.svg)


.webp)
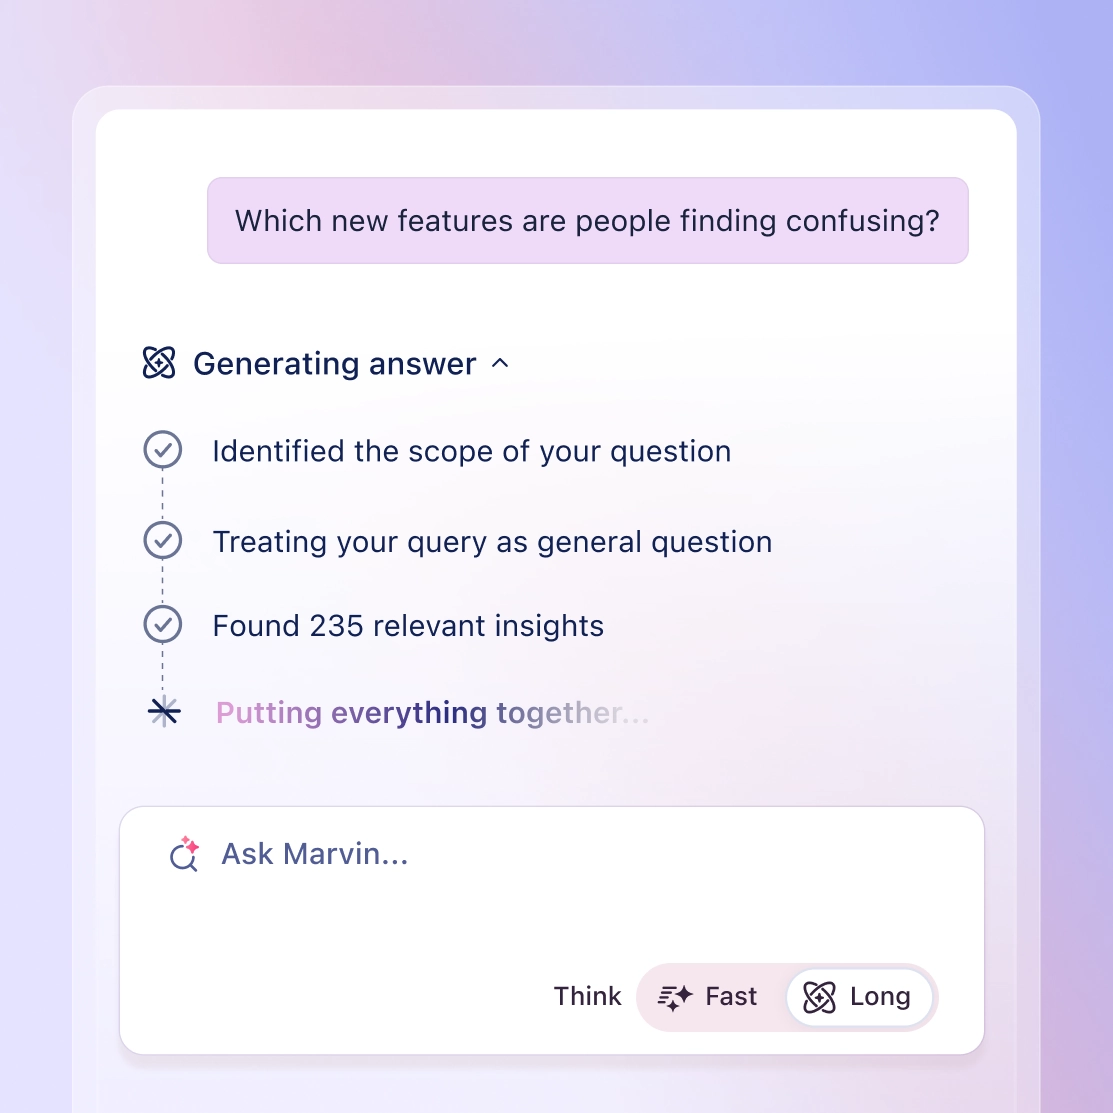
Run qualitative analysis on every interview
Explore Qualitative Analysis
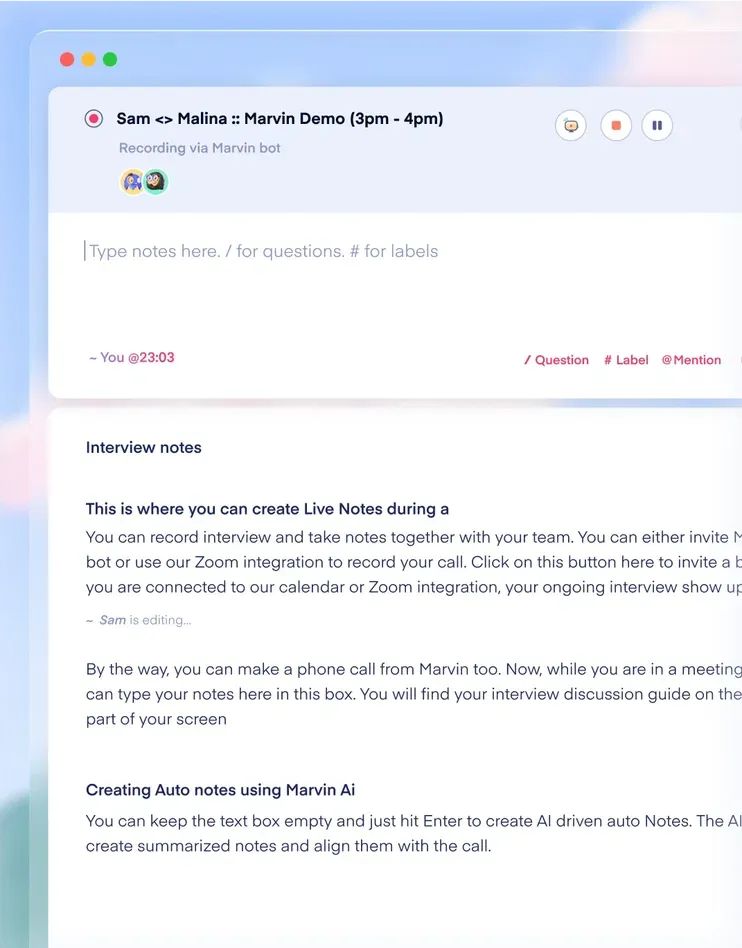
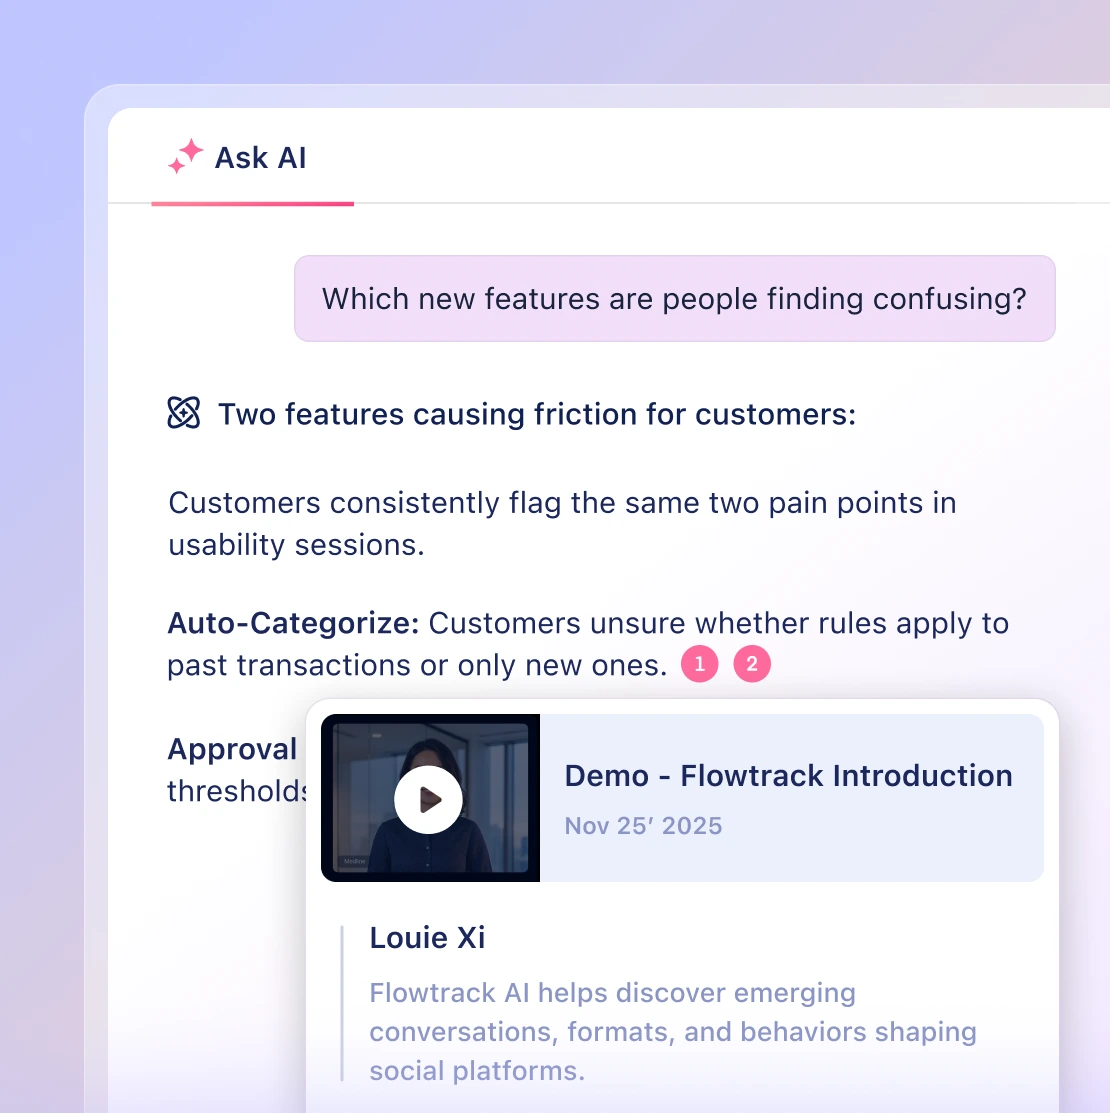
Marvin captures timestamped notes from every virtual interview, focus group, or AI-moderated session.
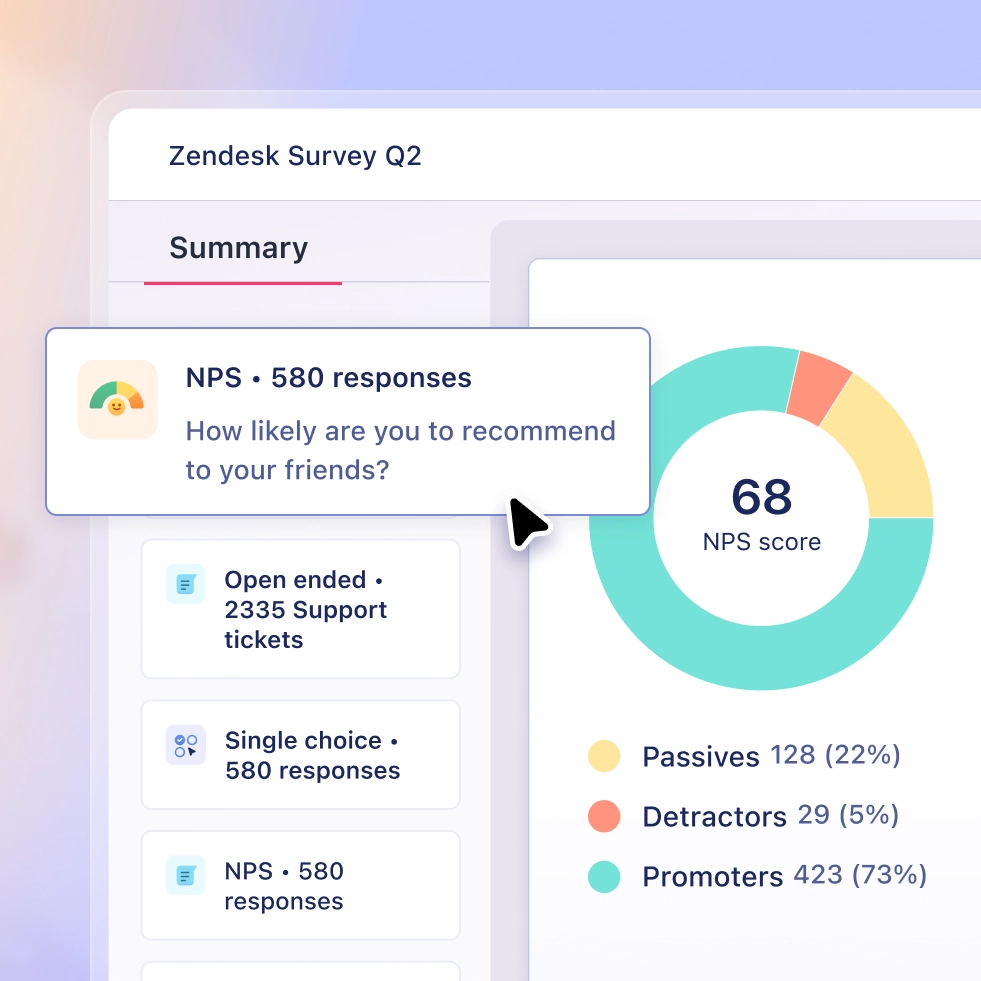
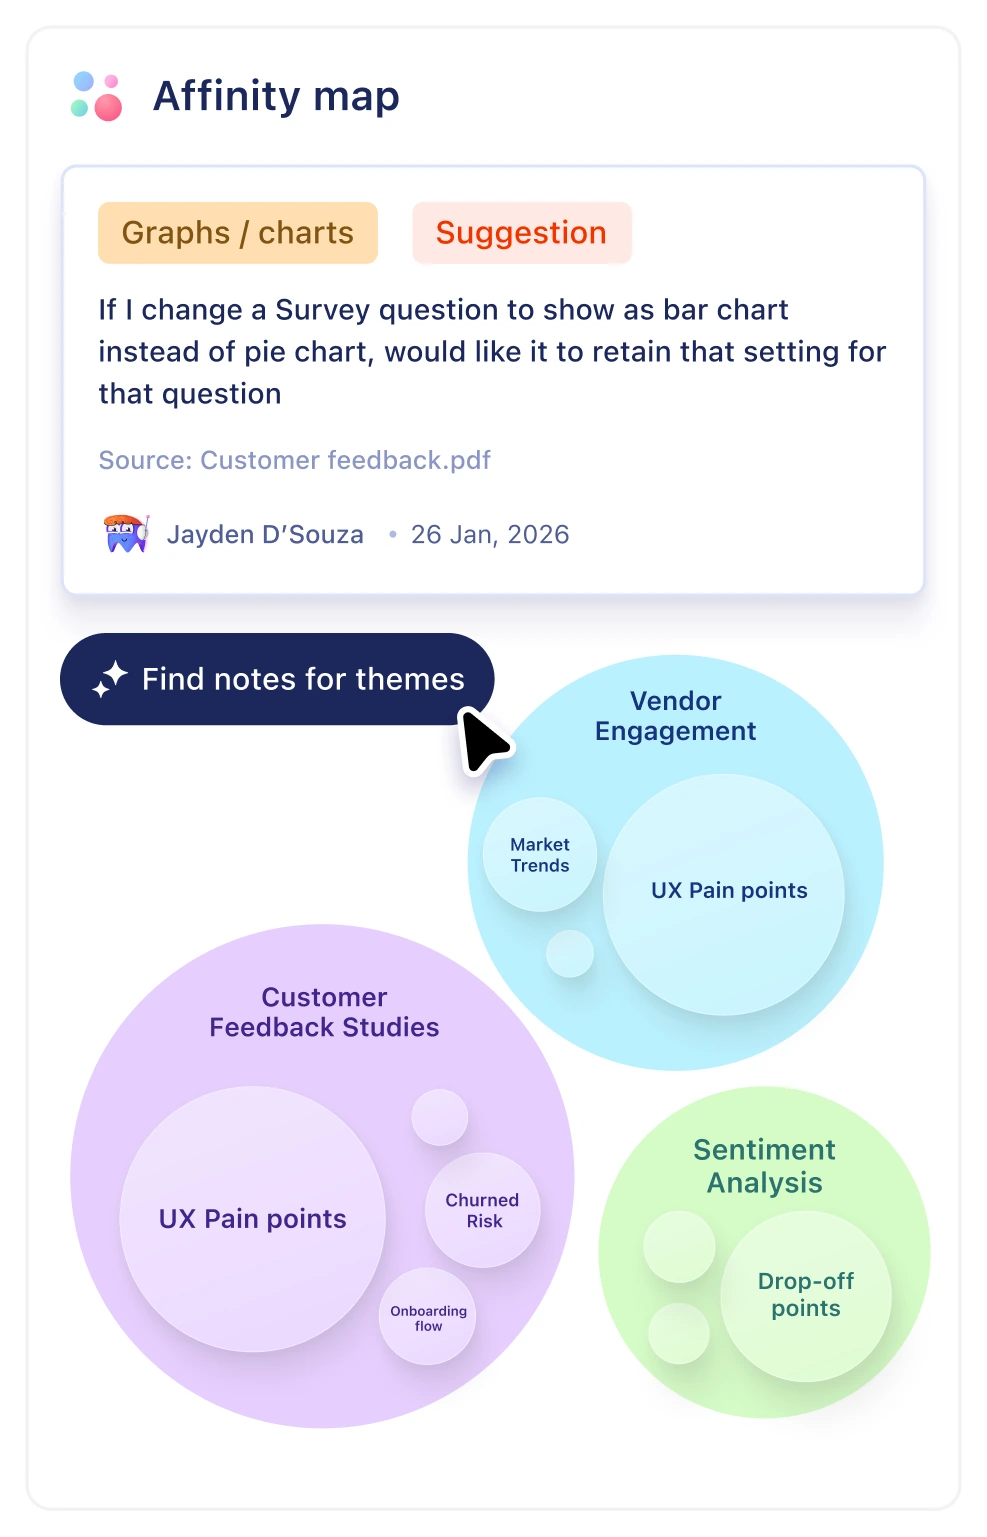
Auto-tagging and thematic analysis surface key themes across all of your sessions.
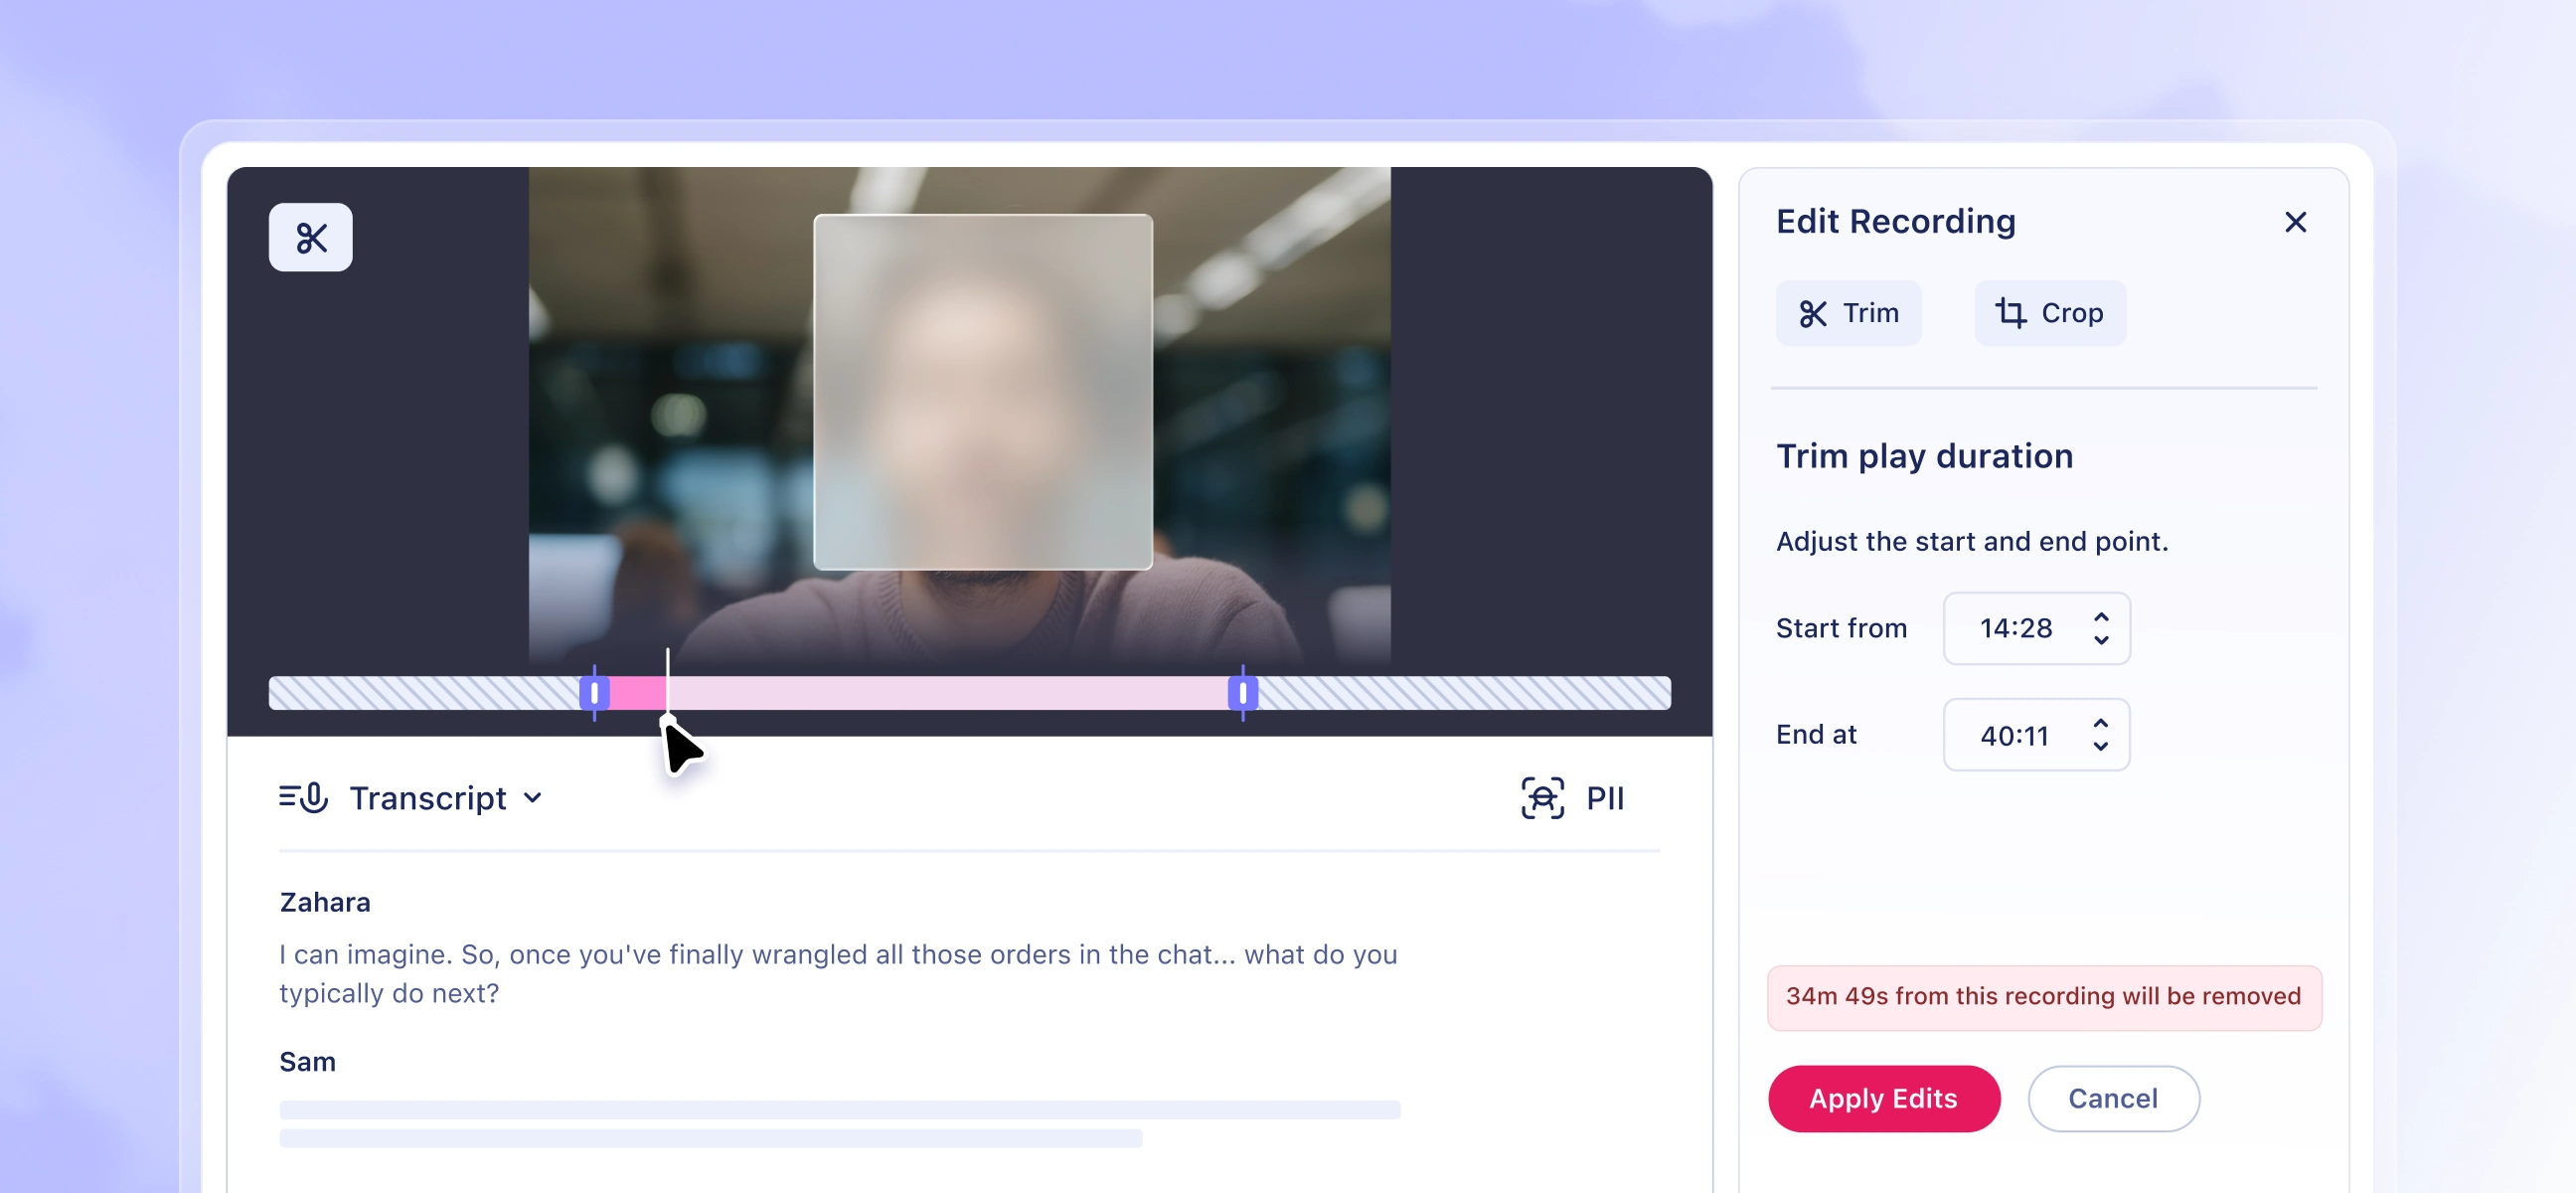
Build shareable highlight reels and link any video clip directly to its original source.