

Designers live to create impactful customer experiences. But how do they determine that impact?
By measuring and analyzing a user’s experience while they are immersed in a product. UX analytics demonstrate how humans actually use a product or service.
And now… we have access to AI-powered UX analytics, which means designers can make more informed and user-driven decisions, faster.
By integrating AI-driven automations into the research and analysis stage, designers can understand a user group’s attitudes, behaviors, motivations and frustrations at scale. In turn, they can create more intuitive and responsive digital products.
Let’s dive into how designers can leverage AI to collect and analyze usable user data.

Key Concepts of UX Analytics
UX analytics involves a feedback loop where you continuously track user behavior, interpret the data, and act on insights. Every cycle builds on the previous, aiming to:
- Refine your product
- Meet your users’ needs
- Drive desirable business outcomes
Let’s break down the three core pillars of UX analytics and how they connect to form actionable insights:
1. User behavior tracking: This is the foundation of UX analytics. It involves using heatmaps and session replays to capture actions — clicks, taps, scroll depth, time spent on tasks, navigation flows, etc.
- You use a heatmap tool and notice users ignore a CTA on your page. That’s a quantitative insight from behavior tracking. It shows the “what.”
2. Contextual understanding: Understanding the context behind behavior reveals the “why.” This concept layers qualitative research methods such as surveys, user interviews, and open-text feedback onto behavior tracking to make sense of it.
- You send a follow-up survey that shows users don’t recognize the button as clickable. This qualitative insight contributes to contextual understanding.
3. Feedback integration and iterative improvement: This last concept closes the loop by turning insights into action. It uses sentiment analysis tools or even manual reviews to identify recurring themes and fixes to prioritize.
- You redesign the button to make it more visually distinct—add a border, increase size, or change color. Then, you A/B test to validate whether the new design improves engagement.

Benefits of Implementing UX Analytics
With UX analytics, you can see how users interact with your product and get the inside scoop of their struggles.
Here are five major benefits of using it to level up your products:
- Precise problem-solving: Stop guessing. See exactly where and why users drop off so you can fix it fast.
- Continuous improvement: Build, test, improve, repeat. Analytics makes iteration a logical, informed process.
- Enhanced personalization: Understand individual user behavior to create tailored experiences that feel intuitive and human.
- Strategic decisions: Whether you’re developing a new feature or redesigning an existing one, analytics guide your choices to align with user needs and business goals.
- Increased team efficiency: Clear insights mean less back-and-forth and more focus on impactful changes.

How AI Augments the UX Analytics Process
It’s not rocket science: A positive experience leads to users staying on a platform. These users return and eventually become loyal customers. A negative experience causes them to abandon the product altogether.
Encountering issues in navigation and usability causes friction. Reducing this friction in the user flow is a designer’s forte. It shortens the path to value, creating better product experiences.
AI-powered UX analytics help designers find these problematic areas. With AI, they can better identify and understand performance issues. Insights help them prioritize issues and take necessary measures to optimize the product.
UX Analytics help answer the following questions about the user journey:
- User Expectations. What do users expect from your website or application? How will they interact with it?
- Activity. What’s the most used feature? How are users engaging with it? How easy is it to switch between features? What behavior correlates with power users?
- Roadblocks. Where are the friction points in the user flow? Any bugs deteriorating the user journey?
AI allows you to catch issues and fix them before users jump ship. It creates a seamless experience that ultimately boosts sales.

What AI Brings to UX Analytics
Traditional UX analysis is a manual and tedious process. By enlisting the help of AI, researchers bring efficiency to their workflow.
Automating tedious tasks frees up a designer’s time. Let AI handle the data collection and processing. Designers can shift focus and delve deeper into analysis.
AI has the ability to analyze datasets with vast data volumes. In less time, AI conducts a more in-depth analysis than traditional methodology. This helps unearth valuable insights that reveal user behavior, preferences and pain points.
We’ve listed some benefits that AI brings to UX analytics:
- Data-Driven Design. AI analyzes collected data from various sources. With it, designers can create more responsive and user-centric designs.
- Efficient Automation. Automating repetitive tasks makes design more efficient. Designers can focus on creative aspects and complex strategic initiatives.
- Increased Scalability & Efficiency. AI can handle large swathes of data. Swift data processing speeds up the research phase. Designers are able to iterate more.
- Accessibility. If programmed correctly, AI can analyze data objectively. It can uncover diverse user insights, ensuring inclusivity in design.
AI has also made data analytics more accessible to startups and small businesses. Without highly advanced technical expertise, they leverage AI to improve the user experience.
AI-driven user behavior analysis improves operational efficiency and helps drive strategic growth. It combines design intuition with rapid data processing.
Let’s further explore how various AI technologies are revolutionizing the design process.
For a quick AI terminology refresher, head over to our glossary.

Natural Language Processing in UX Analytics
Natural language processing (NLP) enables machines to comprehend human language. This opens many doors for further analysis with AI:
- Understanding Language. AI can make sense of unstructured data. This includes text from customer reviews, social media & forum posts, survey responses and support tickets.
- Automate Customer Feedback Cycle. AI automatically collects and analyzes data from a variety of sources. Researchers can glean insights from this data. They get a comprehensive overview of satisfaction levels and areas that need improvement.
- Demystify Customer Sentiment. AI’s data processing sheds light on large unstructured text. This provides deep insight into customer preferences and attitudes. Further, AI can unearth patterns overlooked by traditional analysis.
- Real Time Sentiment Analysis. AI detects consumer emotions and moods in real time. This allows for quick and agile adjustments of the product. It also makes for a highly responsive customer service experience.
NLP helps UX professionals monitor user sentiment. With ever-improving data interpretation, companies gain valuable insights from unstructured information.
AI automates the qualitative analytics process. It increases product agility and helps improve customer experiences.

Machine Learning & Predictive Analytics in UX Analytics
Future planning is critical to a business’ success. No one can predict the future with 100% certainty.
Predictive analytics give researchers an accurate basis from which to work. Businesses identify risks and opportunities as they try to understand their evolving marketplace.
Predictive analytics leverages Machine Learning(ML). Machines perform statistical analysis on past and current data to make future forecasts. ML algorithms are capable of forecasting future outcomes, trends and behaviors. Machines learn from historical data autonomously with no human intervention. This enhances the precision of predictive abilities over time.
There are plenty of applications for predictive analytics in businesses today. It helps businesses optimize operations and make informed decisions.
Examples of Predictive Analytics
- Inventory and Supply Chain Management. Companies use historical sales data to forecast demand. AI systems can predict shortages before they occur, enabling companies to deploy backup plans. This enables them to manage inventory in warehouses more efficiently. Shelves are always stocked, and waste reduced.
- Enhanced Risk Assessment. In the finance industry, predictive analytics uses people’s transaction history to detect and prevent fraud. Machine Learning (ML) models offer an accurate assessment of loan default risks. This leads to smarter lending decisions.
So how can UX professionals leverage this promising technology?
Designers can use ML algorithms to analyze historical and current data on user behavior. They can forecast a user’s future behavior and preferences.
Machine learning algorithms are highly adept at identifying complex patterns and trends. They provide deep insights into customer behavior and market dynamics.
Predictive analytics helps in forecasting user behavior patterns. By identifying potential UI roadblocks, it highlights navigation weaknesses in the user flow. It helps designers adapt the interface for more user-centric design. Designers make anticipatory changes and feature improvements to create a smoother UI.
Predictive analytics is far more reliable than relying on gut feeling. It allows designers to go beyond a reactive strategy. Digital interfaces can now grow faster than customer expectations.

Use AI to Personalize the User Experience
Users want a product that feels natural to use. One that feels tailor-made for them. Where they get what they want out of it. And then some.
AI ushers in a new era of customized experiences.
Today, companies offer omnichannel experiences. We begin on our phones, and expect to seamlessly jump into our computers, without skipping a beat. Personalized products increase a user’s attentiveness and engagement with a product:
- Netflix uses predictive AI analysis to provide personalized recommendations. Their algorithm analyzes viewing history, user preferences and ratings. It then suggests content that matches user tastes. This improves the viewing experience and keeps people glued to their platform.
- Amazon also uses your purchase history and browsing data. They personalize product recommendations for each individual. They push forward product suggestions, reviews and special offers. By anticipating user needs, Amazon encourages repeat purchases (subscriptions) and therefore, revenue.
- With autocomplete, Google finishes your sentences for you. Ever notice when you misspell a search item, you get what you were after anyway? This makes search so much more efficient. A smooth user experience.
AI analytics help companies understand users’ needs, behaviors and goals. Algorithms identify an individual user’s inclinations. They can automatically adjust interfaces based on personal requirements. It creates dynamic user profiles that evolve based on ongoing user interactions.
The algorithms adjust information based on an individual’s preferences. It only pushes relevant recommendations, features and content to your devices. This increases user engagement and (therefore) chances of conversion.
Personalization is a cornerstone of modern UX design. It’s all about creating something that feels tailor-made to each and every user. AI analytics makes this increasingly possible.

Metrics Used in UX Analytics
Every click you take,
Every (cursor) move you make,
Every single day,
Companies will be watching you.
A click, hover, scroll or time spent in an app. These are all quantifiable UX metrics. UX metrics connect user needs with business objectives. Tracking UX metrics helps designers draw a line in the sand. It establishes a point of reference:
Currently, we’re here. How do we get over there?
Types of UX Metrics
UX analytics goes beyond evaluating quantitative data though. It combines qualitative and quantitative data from surveys, interviews and analytical tools. UX metrics fall into three distinct categories:
- Descriptive Metrics provide a basic overview of how users behave when using a product.
- Behavioral Metrics observe how users interact and engage with a product.
- Attitudinal Metrics are tougher to measure than behavioral metrics. They describe a user’s perception when using a product.
Quantitative metrics help evaluate the user experience with numbers. This data helps pinpoint the most important problems and bottlenecks. It also informs you of the severity of each problem. Is it good, bad or neutral?
Quantitative data doesn’t tell you the ‘why’. The underlying reason behind the numbers.
That’s when you need qualitative data — gathered in lab testing or remote environments via interviews, observation or surveys. Qualitative data is more abstract and includes the voice of the customer. It reveals why users aren’t enjoying a particular aspect of your product.
A great user insight is a combination of qualitative and quantitative data. It provides a holistic understanding of user needs.
What’s happening? Why is it happening?
Here are some common forms of data collection:
| Quantitative | Qualitative |
| A/B Testing | Focus Groups |
| Click Testing | Interviews |
| Cohort Analytics | Heatmaps |
| Form Analytics | Session Replay |
| Web Analytics | Usability Testing |
Check out this article for tips on when to use qualitative and quantitative research methods.
UX Metrics to Track
There’s no list of must-track metrics, but we think this is a pretty good start. Remember, the most useful UX metrics have a:
- Timeframe
- Benchmark
- Reason for tracking
- Link to a customer action
Let’s dive into some different metrics, organized by what they measure.
Usability Metrics
| Usability describes a product’s ease of use. What tasks do users have to complete? | ||
| Efficiency | time on task & time based efficiency | Measures how well a user completes a given task within a product. How well does our new feature work? |
| Task completion % | average time taken to complete task / total # of participants | Compare task completion time between experienced and new users. Shows you how easy it is to pick up for newbies. |
| Success rate | # of completed tasks / # of attempts | The higher the number, the better usability. |
| Number of errors | # of errors / # of total possible errors | Expect errors. The percentage of what went wrong compared to all possibilities of going wrong. |
Effectiveness Metrics
| Can users fully comprehend and complete their designated goal? Measure effectiveness before and after a feature or product update to establish a baseline for comparison. | ||
| Engagement | page views, session duration, user feedback | User engagement analytics – as a rule of thumb, the higher these engagement statistics, the better. Likert scales aside, qualitative feedback includes comment sections and open-ended survey questions. |
| CSAT – Customer Satisfaction | # of satisfied customers / # of survey responses | Customer Satisfaction Scores measure exactly that. Based on a 1 to 5 likert scale. Only scores of 4 & 5 count as satisfied users. |
| SEQ – Single Ease Questions | average scores (higher = better) | Typically asks users to rate how difficult a task was. It assumes that the task completion metric (above) may be inaccurate. Typically a likert scale of 1 (very difficult) to 7 (very easy). |
| NPS – Net Promoter Score | % of promoters – % of detractors | One question – an indicator of customer loyalty. On a scale of 1 to 10 users rate “how likely are you to recommend this product to a friend or colleague?” promoters = 9-10 detractors = 1-6 passive = 7-8 |
| CES – Customer Effort Score | sum of customer effort ratings /total # of survey responses | How much effort did customers put in while interacting with your product?Uses a likert scale or emoticon rating. |
| CCR – Customer Churn Rate | (# of customers @ t1 – # of customers @ t0 ) / # of customers @ t0 | Measure of customer retention over a period of time. A higher churn rate indicates that a high proportion of customers are leaving your website or product. Eg. our churn rate was 12% for the quarter ended March 31st. |
Business Impact Metrics
| Measures impact of design on business goals such as revenue to calculate design’s ROI | ||
| Revenue or Sales | (sales @ t1 – sales @ t0) / sales @ t0 | How do product changes move the needle? |
| Customer Lifetime Value (CLV) | (avg. purchase value x avg. purchase frequency) x avg. customer lifespan | It’s easier to retain existing customers than get new ones. This value reflects how much a customer is worth to your company and how much they spend during the course of the relationship. |
| Return on Investment (ROI) | [(net gain from investment – cost of investment) /cost of investment] x 100 | Welcome to the Shark Tank. Every business decision must tie back to an ROI. Considering the time, money and effort expended on the user experience. |
| Conversion rates | free users converted / total free users | If you offer a freebie version and an upgraded paid plan. It’s helpful to see how many people have switched over to paying customers. |
Essential UX Analytics Tools for Businesses
Earlier, we saw how UX analytics relies on a cycle of observing, analyzing, and implementing changes. To support this process, you need a well-rounded UX tech stack.
Below, we’ll show you some of the best UX tools that align with the three key concepts of user research analytics. Each one plays a unique role in turning data into user-centric design decisions.
1. Marvin
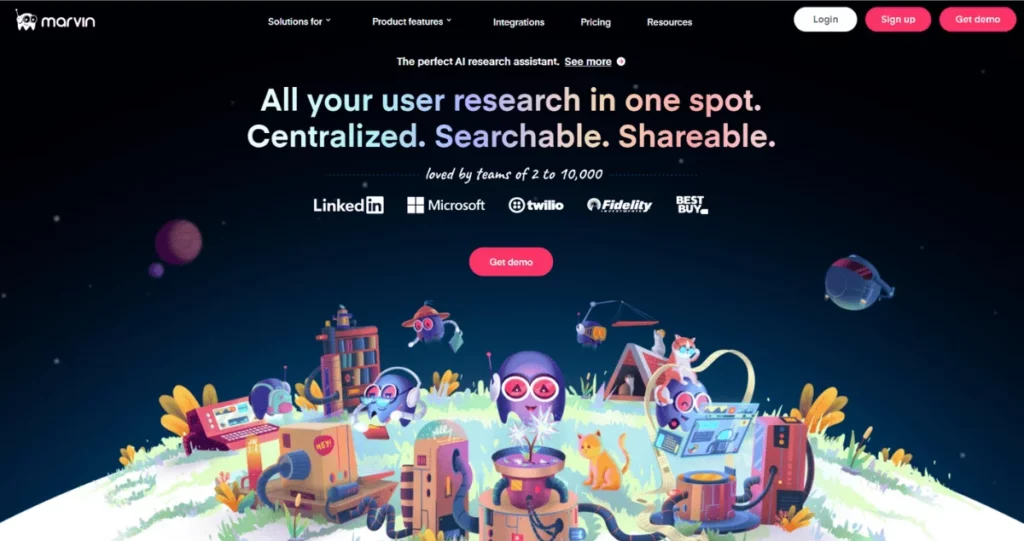
Marvin is your all-in-one UX research platform, designed for businesses that take user experience seriously.
Our tool acts as a research repository, allowing you to gather and organize user feedback with ease. Additionally, it’s also powered by AI workflows, so it analyzes this feedback efficiently and generates engaging visual reports.
You can use it to track feedback from different sources, uncover patterns, and develop strategies all within one tool. Thanks to its intuitive interface, you’ll easily spot trends, identify areas for improvement, and share the customer insights analysis with your team.
Create your free Marvin account today to start connecting the dots in your UX analytics and make confident user-centric decisions.
2. Hotjar
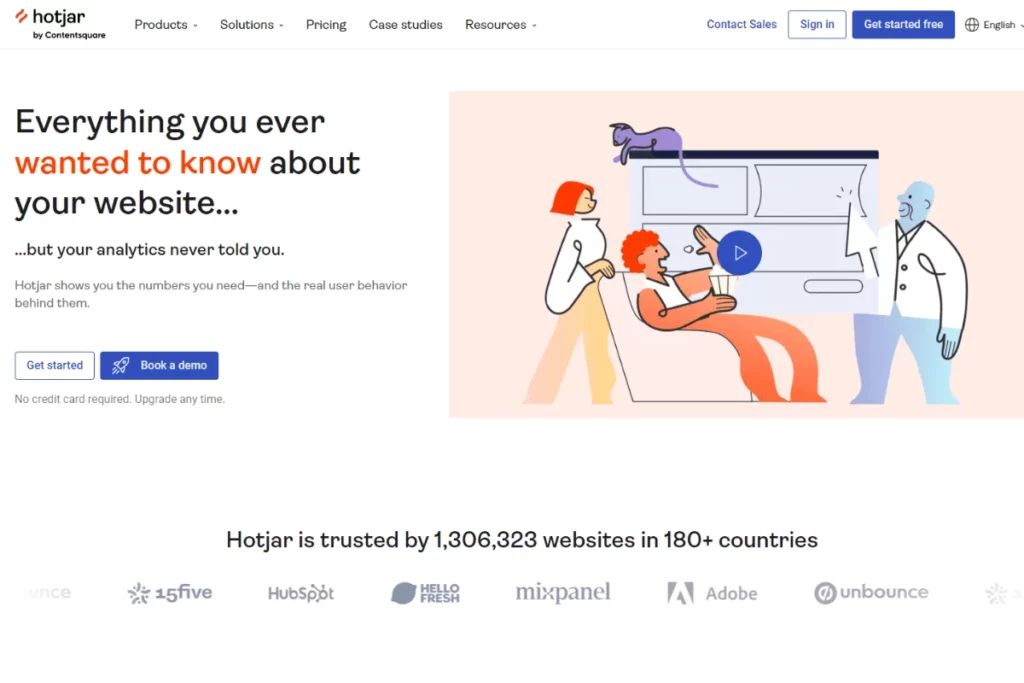
This tool complements Marvin by providing heatmaps and screen recording sessions that show where users click, scroll, and linger on your website.
Hotjar also gives you the option to pop a targeted survey in real-time. You can, again, automatically analyze that data in Marvin to get the full picture of your user’s behavior.
All in all, it’s a handy instrument for identifying specific areas of friction, such as confusing navigation or underperforming CTAs.
3. Google Analytics
A staple for tracking user behavior at scale, Google Analytics is more focused on quantitative data.
Whether you’re looking at page views, bounce rates, or session durations, it helps you determine how long users engage with your content.
You can also analyze traffic sources to see where users are coming from and understand what drives visitors to your site.
4. Crazy Egg
Crazy Egg is another great tool for understanding how users interact with your website. It offers heatmaps, A/B testing, and user journey analysis.
Its simple visualizations make it easy to spot design elements that need improvement.
If you need more quantitative insights to understand where to focus your qualitative research efforts, Crazy Egg might help.
5. Optimal Workshop
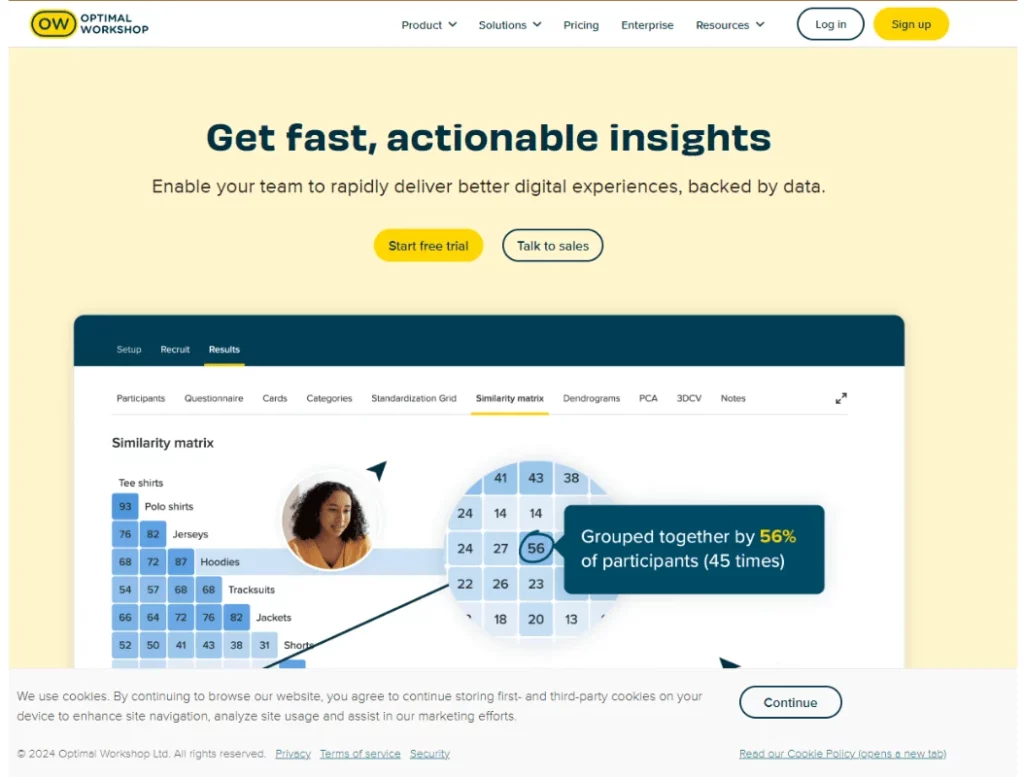
Optimal Workshop is a solid resource for refining information architecture.
This platform was built for enterprise research and is packed with first-click testing, tree testing, and prototype testing tools.
Because it fits right into your design workflows, you can quickly and easily obtain real user feedback on what you need to improve.
In short, Optimal Workshop helps ensure that your website’s navigation aligns with user expectations.
How to Conduct UX Analysis Using AI
Using AI for user experience analysis speeds things up and provides you with precision and depth.
Here’s a step-by-step process to integrate AI into your UX research and analysis:
1. Clarify the scope and goals: What do you need to solve? Are you analyzing onboarding friction? Measuring feature adoption? Boosting conversion rates? Clear goals keep you focused and avoid data overload.
2. Build a comprehensive data set: AI performs at its best when it has varied, high-quality data. Gather quantitative and qualitative data from cross-channel touchpoints — web, mobile, and even offline if applicable.
3. Leverage AI to clean and organize data: Use AI tools to structure and clean the data. Get rid of duplicate entries, irrelevant metrics, and incomplete feedback automatically.
4. Identify behavioral patterns and friction points: Look for clusters of behavior that indicate common user paths, preferences, or frustrations. Use anomaly detection to highlight unexpected behaviors, such as an unusual drop-off rate after a new feature launch.
5. Contextualize findings with user sentiment: Use Marvin for sentiment analysis on your reviews, open-text survey responses, or support tickets. This helps connect behavior data with user emotions and motivations.
6. Prioritize changes using predictive models: Use predictive analytics to assess the potential impact of fixes. For instance, if AI predicts a 20 percent increase in engagement by simplifying navigation, prioritize that change.
7. Test, validate, and iterate: A/B testing, multivariate testing, and usability testing can help you determine which changes improve user experience. Use AI-powered analytics to monitor churn or feature adoption rates and validate your assumptions.
8. Create a continuous feedback loop: Automate periodic reporting using AI dashboards. Use these to spot trends, anomalies, and actionable recommendations for your team.

The Future of UX Analytics and AI
As technology advances, the potential for deeper, more personalized user experience insights grows. The future of UX analytics involves:
- Hyper-personalization at scale: Interfaces will evolve dynamically based on user behavior, preferences, and context. Every interaction will feel uniquely tailored.
- Predictive UX design: Instead of reacting to problems, predictive AI will anticipate user needs and frustrations. Thus, designers will be able to address potential issues and opportunities right from the design phase.
- Voice and conversational analytics: With voice interfaces and chatbots, UX analytics will extend beyond clicks and taps. AI will analyze tone, intent, and language patterns to refine conversational experiences.
- Democratization of advanced analytics: AI tools will be more accessible to smaller teams and non-technical users. More people will use UX analytics tools with automated insights and intuitive interfaces to innovate across industries.

Frequently Asked Questions (FAQs)
Here’s what else you should know about AI’s powerful impact on UX analytics:
How Do Analytics and AI Work Together?
Analytics is the practice of collecting and interpreting user data to improve experiences. AI is a technology that can power this practice, making it faster and smarter by:
- Automating data processing
- Identifying trends
- Generating insights at scale
How Can Analytics UX Improve Design Processes?
UX analytics streamlines design by highlighting pain points, user preferences, and behavior trends. It ensures design decisions are data-driven, enabling teams to:
- Prioritize changes
- Test features effectively
- Iterate faster
How Does UX Analysis Enhance User Engagement?
UX analysis identifies what users value and where they struggle. It also addresses these issues and helps to:
- Reduce friction
- Create smoother interactions
- Improve usability, personalization, and features.
All these keep users engaged and increase satisfaction and retention.
What Insights Can Be Gained from User Experience Analytics?
UX analytics combines quantitative and qualitative data to reflect user behavior fully.
Quantitative data (clicks, session times, etc.) highlights patterns and performance issues, while qualitative data (surveys, interviews, etc.) reveals user motivations and frustrations.
Together, they uncover what’s happening and why, guiding user-focused improvements.
Conclusion
UX analytics is critical to refining products until they truly resonate with users.
Without behavior tracking, contextual understanding, and AI-driven user experience analytics, you can hardly design intuitive, impactful experiences.
If you’re ready to give UX analytics the full attention it deserves, create a free Marvin account today.
Our UX research repository and AI-powered assistant will let you gather, analyze, and act on user insights in one intuitive platform.
To Be Continued…
Learn how to establish your UX analytics strategy with AI in part 2 of article.
Check out some of our other resources about incorporating AI in your UX workflows:
- Design + AI: An Expert’s Take on How They Work Together
- The Best AI Tools for UX Research & Design
- Why UX Designers are the Driving Force Behind Responsible AI
Hero photo by Hunter Harritt on Unsplash