Researchers turn mountains of unstructured and messy data into useful information.
Survey analysis software helps them in their quest for insights. It brings efficiency and deeper analysis to the research process. Companies understand their users and make more informed decisions. Improve the user experience, with analysis software.
Trade tediousness for technology and bid farewell to the manual drudgery.
Use our guide for choosing the right survey tool best suited to your research needs.

TL;DR – Top 6 Survey Analysis Software
In this article, we explore the best tools for survey analysis. We’ll dive into the functions and features that make each of these hard hitters stand out.
Here’s our shortlist of the six best survey analysis tools:
- HeyMarvin
- Crunch.io
- KnowledgeHound
- MAXQDA
- SentiSum
- SurveyMonkey
Look for platforms that offer survey building and distribution, data collection and analysis in one place. Marvin streamlines your journey from survey insights to impactful results. Find out how.

What is Survey Analysis Software?
Surveys are an easy and inexpensive way to get user insights at scale.
An analysis software helps researchers turn raw, unstructured data into strategic, actionable insights.
Tools for survey analysis offer everything from basic data crunching to purpose-built analytics. Whether single purpose or an entire suite of tools, researchers visualize and analyze survey responses.
Insights help businesses improve the customer experience and tweak their strategies or processes.
Powered by artificial intelligence (AI), modern survey analysis software reduces manual data processing. Researchers dive deeper into data to unearth insights that improve performance across the board.
How does a survey analysis platform augment the research process?
Benefits of Using Survey Analysis Software
- Efficient Data Management. Streamline data collection and organization. Use automation to reduce human error and data redundancy. This ensures that data is accurate and readily accessible for analysis.
- Advanced Analysis. Tools perform sophisticated analytical procedures. These include sentiment analysis and predictive analysis using advanced statistics.
- Reporting Capabilities. Create comprehensive and detailed reports with eye-catching visual elements. Communicate easy to understand findings to stakeholders easily and facilitate information sharing.
- Resource Efficiency. Time savings + resource saving(?). Automate parts of the survey and analysis process. Speeds up the cycle and reduces costs of manually conducting this work.
- Scalability. Handle large volumes of data. As a business grows, software can evolve and meet its growing data needs without too many changes.

How to Choose the Best Survey Analysis Software
Consider the following when choosing a tool for survey analysis:
- Research Goals & Outcomes. What problem are you trying to solve? Determine what the output of analysis looks like. How does it impact business direction and strategy?
- Users. Gather the prospective users who will interact with the tool regularly. What are their goals? Which stakeholders will benefit from this tool? Will it be easily accessible to non-users?
- Data Analysis. Identify the features and functionality you need. Will basic tabulations with significance testing suffice? Or do you need advanced features such as textual or predictive analytics?
- Data Visualization. Helps convert raw data into graphical representations. Identify patterns with ease and digest information quickly.
- Data Security. What data privacy protocol does the tool adhere to? Ensure your tool is compliant with local data privacy standards.
- Integrations. What tools does the software need to integrate with? Can you consolidate functions and replace certain tools? Don’t compromise your existing workflow. Enhance it with integrations.
- Ease-of-Use. Is there a steep learning curve? Does the tool require specialized knowledge? New users shouldn’t have to spend too much time learning the ropes. User-friendliness is key.
- Budget. What’s the budget? Is it for a one-off project or regular analysis? Do you envisage ongoing use? Free versions may not be suitable for power users.
- Customer Support. Often, a key differentiator is the relationship and rapport you build with companies. You need round-the-clock support for when you get stuck. Choose a company who’ll guide you through their features for survey analysis.

6 Best Survey Analysis Software
Once you’ve established your requirements, it’s time to evaluate survey analysis software. Which one will meet your company’s needs?
No messing about here. Here are six of the best survey analysis tools on the market:
1. HeyMarvin
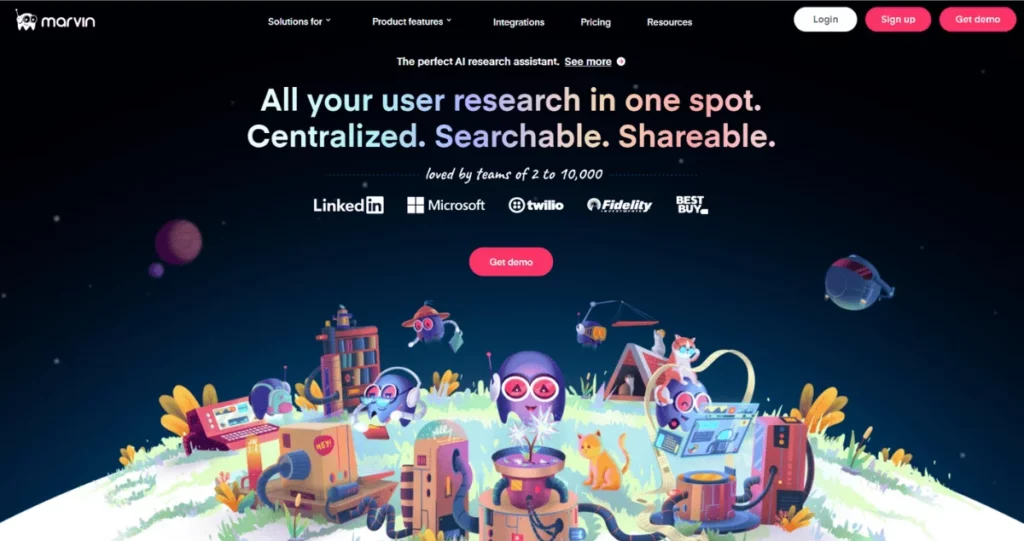
Marvin is a smart survey software that provides a visual representation of your responses. Helping you analyze, decipher, and share your key survey insights.
Marvin uses Natural Language Processing (NLP) to analyze qualitative responses. AI summaries help you gather the crux of open-ended questions. Additionally, they highlight key findings and identify themes across studies. Let our AI engine conduct preliminary analysis before you even begin yours.
Marvin is a company-wide collaboration tool. Take Live Notes together with colleagues during interviews and focus groups. String together clips of audio and video to create playlists. Share these with key stakeholders and decision makers.
A research repository tool that houses all your research data. Bring qualitative and quantitative data into Marvin for analysis. Search through and interrogate data across projects with Ask AI. A handy ChatGPT-esque search bar that allows you to ask questions of data. Bring data to life with charts, graphs and other visualizations.
Don’t break stride with your current workflow. Marvin integrates with apps you know and love. Check out all our integrations.
Marvin offers real-time sync with survey responses from SurveyMonkey, Pendo, Qualtrics and Google Forms. Import thousands of survey responses and Marvin will analyze the data and present insights to you.
In our eyes, there’s only one tool that completely augments survey analysis. Conduct all your analysis in one place. Explore Marvin.
2. Crunch.io
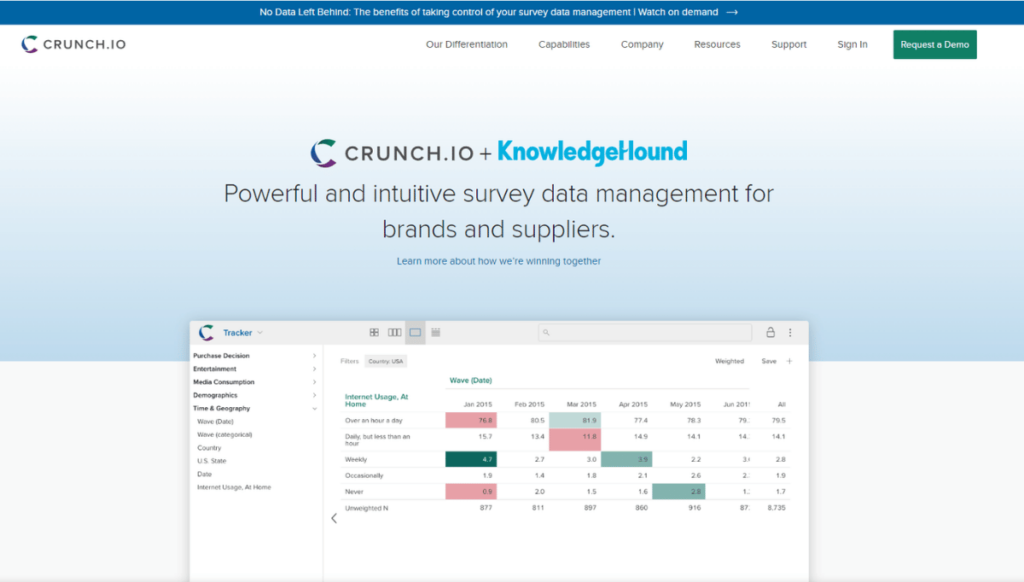
Crunch uses a powerful engine that’s optimized for survey analysis and market research.
Crunch is a collaborative tool with the ability to manipulate data for analysis. Use statistical testing to analyze current and historical data from multiple sources. Use what-if analysis to accurately forecast future trends with predictive modeling features.
It offers customizable dashboards and visualizations specifically designed for survey analysis. A secure and scalable analysis software. However, its price is prohibitive for small teams.
Useful integrations include tools such as Qualtrics and Tableau. Speaking of which…
A Worthy Alternative: Qualtrics is an experience management platform with advanced analytics. A highly flexible tool, it houses everything from survey creation to distribution. Conduct advanced statistical analysis. Use Qualtrics’ powerful predictive intelligence to stay ahead of the curve.
3. KnowledgeHound
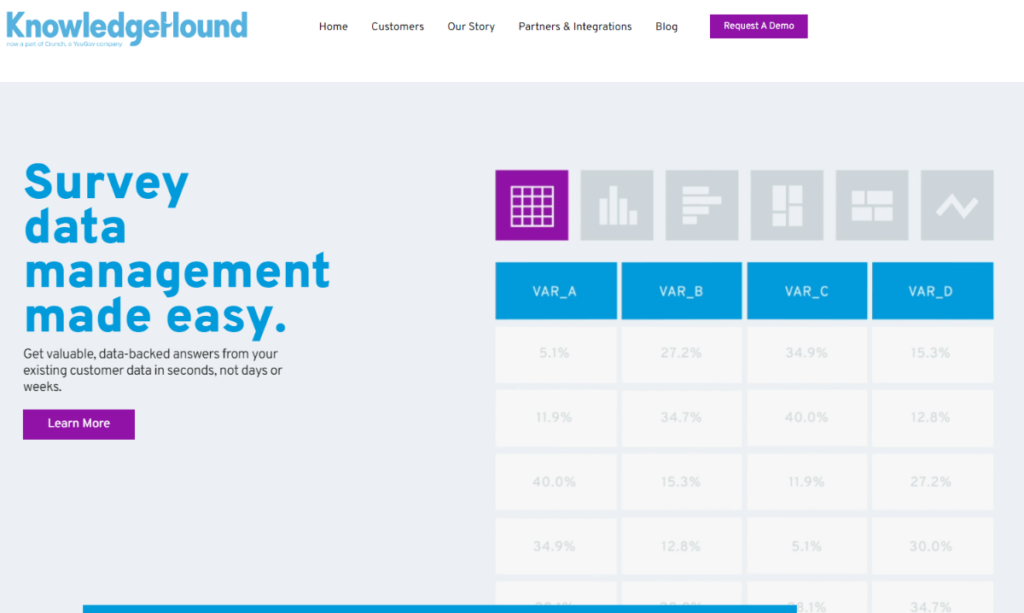
Use KnowledgeHound to get data-backed answers from your datasets. Receive nuanced insights from volumes of unstructured data. AI reveals insights you might miss.
KnowledgeHound has a laundry list of proprietary text analytics.
With the ability to build custom ML models, tell the software exactly what to look for. Topic modeling and thematic analysis reveal key themes and contextual relationships within feedback. Auto-categorization of textual data speeds up preliminary analysis.
Use multilingual sentiment analysis to gauge user feelings across languages. KnowledgeHound offers dashboards to visualize your data. Import data from Lucid, Qualtrics, Survey Monkey and export to Tableau for further visualization.
It has an intuitive interface that makes complex analysis manageable. However, it may be a steep learning curve for non-tech users.
4. MAXQDA
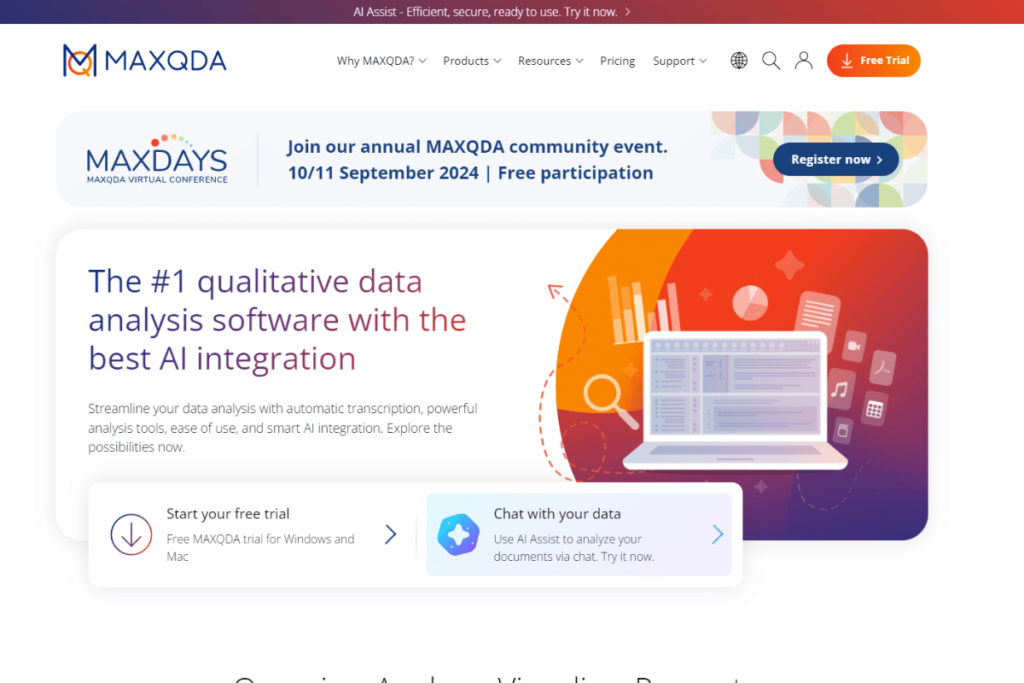
A professional’s analysis tool, turn data into insights with MAXQDA.
MAXQDA’s analytical engine combines processing power with flexibility to analyze data granularly. It supports mixed method research – analyze both standard quantitative and open-ended questions. Use MAXQDA to get a well-rounded understanding of user behavior and preferences.
A host of features make the tool highly customizable. These include creating focus group controls for data collection. Use its advanced data coding for qualitative analysis.
In-house, MAXQDA has excellent analysis & visualization tools. Geo Mapping helps gain an understanding of how diverse participant representation actually is.
Useful integrations enable you to import audio, video and image files for analysis.
Its reporting tools integrate with visualization applications such as Tableau.
5. SentiSum
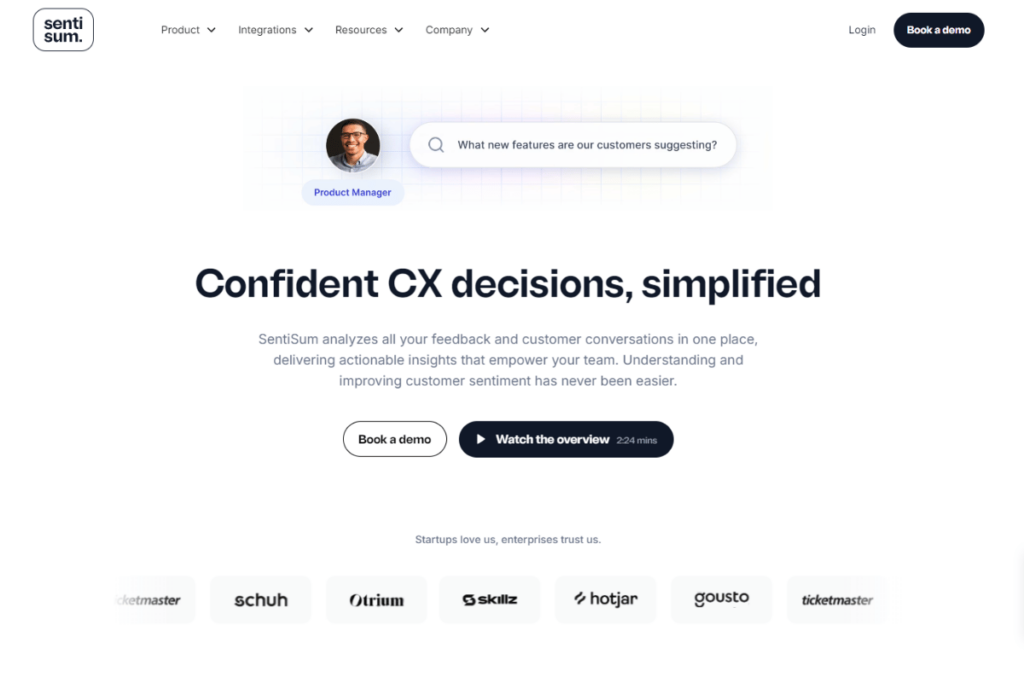
A powerful analysis tool, great for extracting the hidden meaning within textual data.
ML algorithms help you understand unstructured text from open-ended responses. As its name suggests, the tool uses impressive NLP for sentiment analysis. Analyze text and extract keywords and phrases to identify trends in datasets.
Automate the analysis of CSAT scores. SentiSum provides insights in minutes. However, its analytics capabilities extend beyond surveys.
Use predictive coding and SentiSum auto suggests categories. Conduct detailed statistical analysis. Fair warning – complex analysis features may not be easy to understand for newbies.
Visualize data and share results with your peers. Use its APIs to enable sharing with different platforms. Best suited to customer support and user experience teams with high survey volumes.
SentiSum has an easy-to-use interface, and doesn’t require any coding experience. It is expensive, though.
6. SurveyMonkey
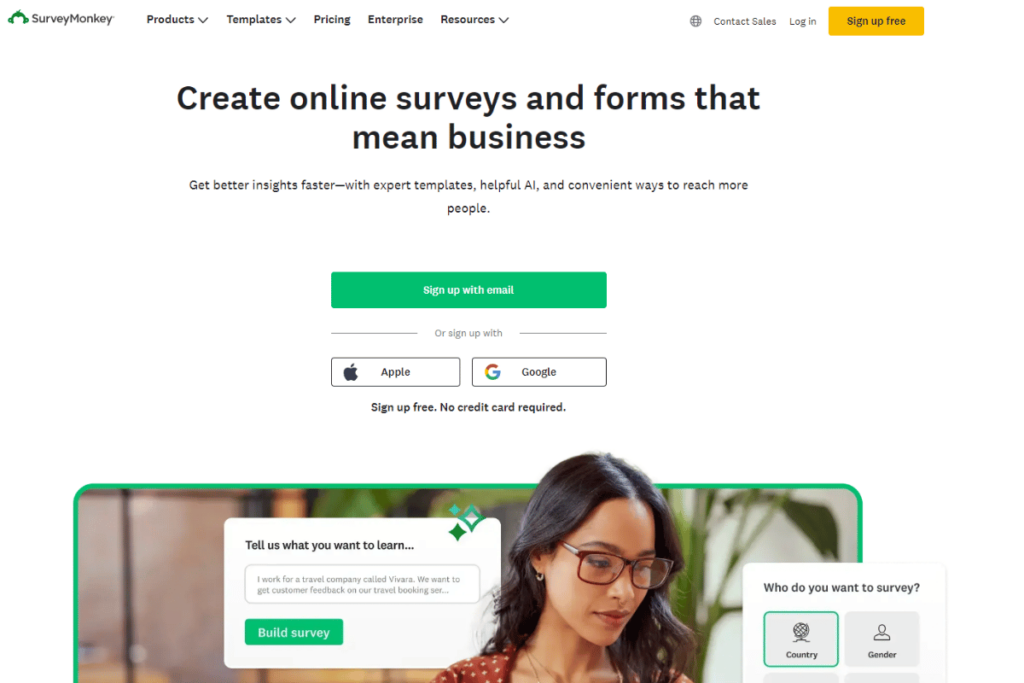
Millions of people use SurveyMonkey across the world. It’s available in 20 languages!
Creating surveys is a breeze – customize yours with skip logic, question types and branching logic.
SurveyMonkey’s analysis capabilities may surprise you. Analyze survey results with a drag and drop builder or use their templates. SurveyMonkey uses NLP to perform sentiment analysis on open-ended responses (free text).
Use logic and data filters to comb through survey results. Conduct text analysis and categorize themes based on sentiment. Export results to Microsoft Excel, HubSpot, Power BI and Salesforce to further visualize your data.
SurveyMonkey’s customer support is excellent. Resources such as specialized toolkits help professions across industries. These include survey templates, guides and tips on how to collect and analyze data.
Solo entrepreneurs, and enterprises small and large use SurveyMonkey to identify growth opportunities.
P.S. Added Bonus: It now integrates with Marvin!
Not satiated? Head over to our guide of the Top Survey Tools for UX.

Types of Survey Analysis Software
Once you’ve established your business requirements, it’s time to choose a tool type. Establish your budget, data processing needs and functionality needed at your research practice.
Here’s a quick rundown of the various kinds of survey analysis tools:
- Survey Software (Built-in Analytics). Specialized platforms that facilitate the entire survey process. Build surveys, conduct research and analyze your data within the app. Create and share reports with key stakeholders.
- Advanced Data Analytics Software. Combine surveys and other important business metrics such as CRM or sales data. Used to analyze big quantitative and qualitative data. Usually expensive and tailored to large companies’ with large data processing needs.
- Textual Analytics Software. Uses Natural Language Processing(NLP) to extract contextual insights from open-ended questions. Some examples include:
- Sentiment Analysis. Evaluates texts and assigns a score to words and phrases. It’s +1 for positive sentiment, 0 for neutral, and -1 for negative sentiment.
- Keyword Analysis. Identifies specific keywords within text and labels them accordingly. A starting point to creating themes from unstructured data.
- Topic Analysis. More advanced than keyword analysis, it extends beyond identifying keywords and labeling them. AI engines look deeper into the context to understand user problems.
- Data Visualization Software. Create powerful, responsive dashboards and visual representations. Store and analyze data from multiple data sources. Popular applications include Power BI and Tableau.
- Spreadsheets. Conduct basic analysis of surveys using old school, traditional options such as Microsoft Excel or Google Sheets. Use formulas, dynamic tables, and simple analysis functions. Takes a long time to set up your files to run smoothly.

Frequently Asked Questions (FAQs)
Below we answer the most frequently asked questions about survey analysis software:
How Secure Is Survey Analysis Software?
Research participants share personal and identifiable information (PII) when taking part in studies. This data must be handled confidentially and securely. Protecting their anonymity is of utmost importance. This increases the likelihood of collecting accurate and honest responses.
Having data privacy protections in place ensures that confidential data stays just that.
Look for tools that comply with local data security standards and guidelines. Firms who collect data from a geographically diverse participant pool must be cognizant of data privacy laws in each country.
Be wary of tools with no mention of data privacy and security. If you can’t find any details about their policies, chances are they have none.
When it comes to protecting user data, better safe than sorry.
Marvin is GDPR, SOC2 and HIPAA compliant. Achieve global standards of security. Learn more about Marvin.
Can Survey Analysis Software Integrate with Other Tools?
You bet they can!
UX professionals rely on several applications in their workflow. Designers use tools like Figma and Notion for project management. Researchers use everything from Google Forms to Qualtrics surveys to gather user feedback. Marvin integrates with tools that researchers and designers love.
Look for a survey analysis platform that allows you to import and export data easily. Integrations with marketing, CRM and business intelligence tools bring all your data into one place. Analyze data from multiple sources and share insights with stakeholders and decision makers.
Don’t disrupt your existing workflow. Augment it with integrations.
What Are the Limitations of Survey Analysis Software?
Survey analysis tools have limitations that affect the accuracy of results.
Stay clear of these when conducting analysis:
- Design Errors. Users setting up studies incorrectly can lead to biased results. A knowledge of complex analysis is mandatory. Inappropriately using software leads to flawed conclusions and inaccurate interpretation of survey results.
- Partial Coverage. Surveys reveal only a part of the customer experience. They don’t reveal behavioral patterns. To understand the big picture, analyze survey results in tandem with usability testing and user behavior data.

Conclusion
Dissecting survey data used to be a cumbersome, manual task. Survey analysis software breathes new life into the research process.
They are often equipped with smart AI features. The AI enhances qualitative research by uncovering deeper insights more efficiently.
The ability to quickly assimilate and analyze data helps companies stay on top of market trends and behavior. Survey analysis software helps turn unstructured and messy data into actionable insights
Choosing the right survey analysis tool improves the quality of research. Consider your business’ and user needs as you make your choice.
House all your survey data and analysis in Marvin, so it’s always there when you need it.
This is the part where we tell you to sign up for a free demo. Don’t take it from us:


