Companies across the globe spent over $1.3 billion (collectively) on research and development in 2023. Their weapon(s) of choice?
Research tools.
Businesses use market research to learn about the industry they operate in. However, conducting traditional research is a complex procedure. Not to mention manual, time-consuming, and exhausting. Researchers have way too much on their plates already.
Market research tools bring automation to the process.
They help companies discover more about their customers, competitors, and industry. Learnings from research studies inform business decisions. It paves the way for new innovation. Use market research to identify risks, opportunities, and underserved needs in the marketplace.
Learn how market research tools drive business growth.
Dive right into a market research platform that streamlines your entire workflow. Try Marvin for free!

What Are Research Tools?
Research tools include any resources, applications, or techniques that augment the research process. Researchers use them to plan, collect, organize, analyze, and disseminate information. Tools vary in function — they help during different stages of the process, from lit review through to analysis.
So, what’s the benefit of adding research tools to your workflow?
Efficiency and effectiveness.
No longer do researchers have to undertake every aspect of the research process. Tools for market research facilitate cumbersome tasks, so researchers don’t have to. Automating data collection and processing increases the productivity and scale of a research practice.
In turn, researchers spend more time analyzing their data, looking out for insights. Collaborate with key stakeholders to make strategic and informed decisions. For instance, research findings help designers create more intuitive and user-friendly designs. This boosts customer satisfaction and, hopefully, revenue.
Research tools help turn data into actionable insights. They promote the use of accurate, vetted data to inform decision-making. Identify new channels to reach customers. Monitor the entire process and organize your research studies with tools for research.
Widely available and accessible, research tools have changed the way businesses handle data.

Types of Research Tools
Golfers don’t use one club during a round. Depending on the distance to the hole and the surface they’re hitting from, they use specialist clubs.
Conducting research is much like playing golf — frustrating! (Poor joke…). You need a host of tools for various tasks associated with effective research. This list of research tools identifies applications that augment every stage of the research process:
Qualitative Research Tool
Qualitative information helps unearth an individual’s perspective. Researchers explore emotions, attitudes, motivations, and frustrations to understand the context around user behavior. Analyzing non-numerical qualitative data isn’t straightforward — it’s convoluted and complex.
Luckily, there’s a research tool that brings automation and efficiency to the entire process.
Marvin
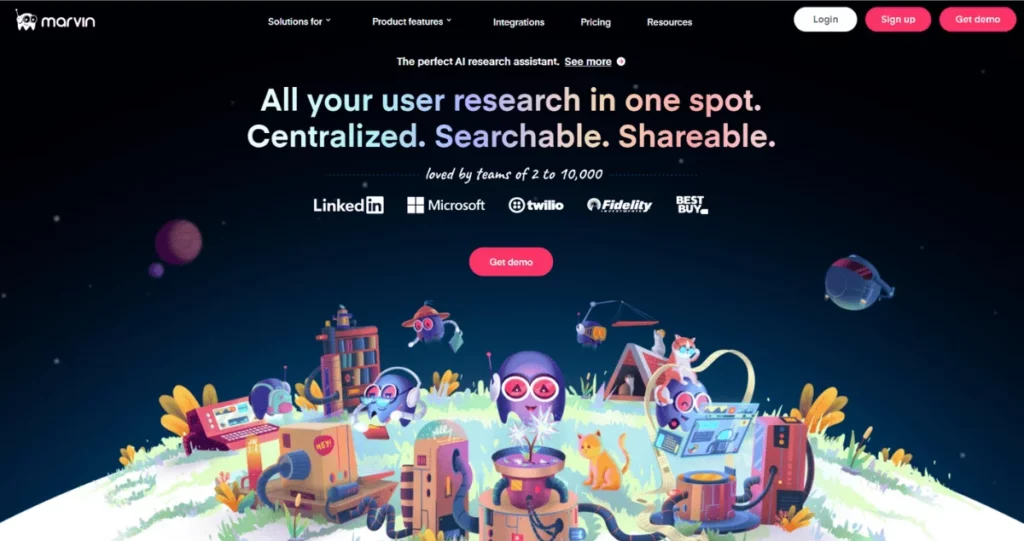
Marvin is home to all user data — a centralized research repository for your qualitative data. And it’s packed with features that augment research:
- Supercharged interviews: Invite Marvin to Zoom, Meet, or Teams meetings for accurate transcripts in over 40 languages and for time-stamped insights.
- Survey management: Create and distribute surveys using the research panel. Marvin automatically analyzes responses and produces rich insights with charts and graphs.
- Intuitive AI: Ask AI is the ChatGPT for your research data. Ask questions about your data across projects. A shiny new feature — Marvin’s AI even extracts insights from images and graphs.
- Powerful analysis: Qualitative data involves categorizing data into themes. Use the analyze feature to effortlessly tag and visualize data. Learn how to tag data and reach insights faster using Marvin.
- Collaboration station: Cut files together to create highlight reels. Share snippets easily with peers across the organization. Elevate the user’s voice.
- Ironclad security: We don’t sleep on protecting confidential user data. Marvin is GDPR, SOC2, and HIPAA compliant. Safety first, and always.
Use Marvin from ideation to execution. Sign up for a free demo today.
Market Research Tools
The best market research tools help businesses learn about their environment. Researchers gain a deep understanding of customers, competitors, and the broader industry. Learn more about the user experience and competitive landscape with these tools for research:
Qualtrics
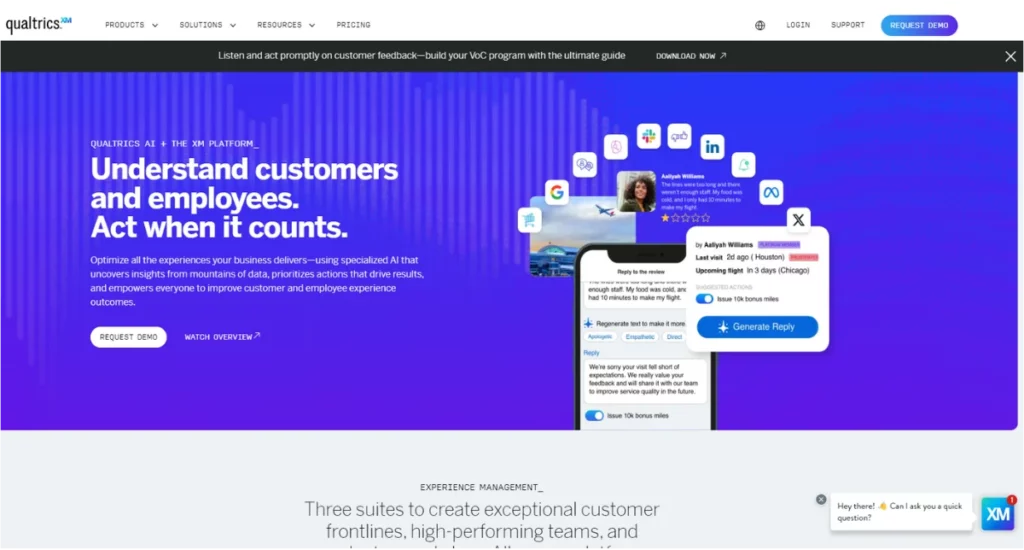
A customer and employee experience management platform. Qualtrics helps you collect feedback at various touchpoints from important stakeholders. Gather data in real-time for more agile decision-making.
The platform has advanced data analysis functions. Sentiment, visual, and predictive analyses help paint a comprehensive view of the customer journey. Connect effortlessly to Marvin to carry out a deeper analysis.
Make informed, strategic decisions with Qualtrics’ AI-generated insights. Build better products, enhance the customer experience, and keep employees on-side.
Think with Google
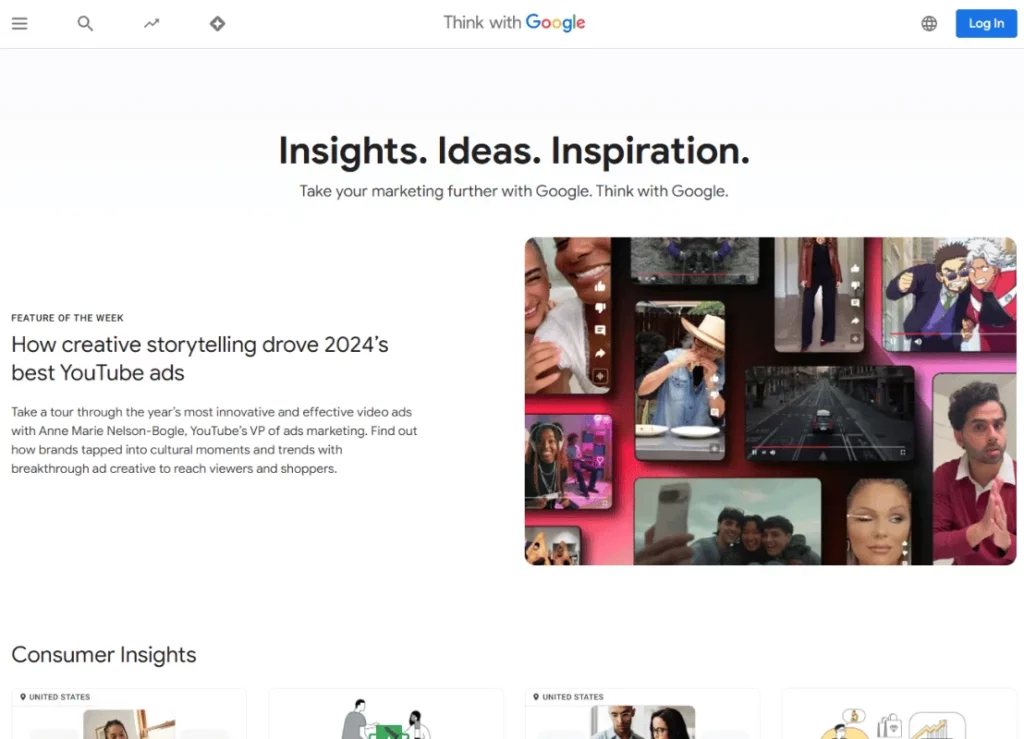
Take advantage of freebies offered by Google. Think with Google offers several tools for market research.
Scope out potential new markets and discover detailed industry information. Insights Finder helps you plan and track campaigns and take action based on insights. Browse innovative creatives from advertisers to get inspired.
With Google Trends, track search patterns across the globe. Stay informed of market trends and tailor your messaging to changing consumer preferences. Get ahead of the next big thing.
Plagiarism Checkers
Ensure your content is 100% original by running it through a plagiarism checker. This helps avoid encountering legal trouble later down the line. Better safe than sorry:
Scribbr
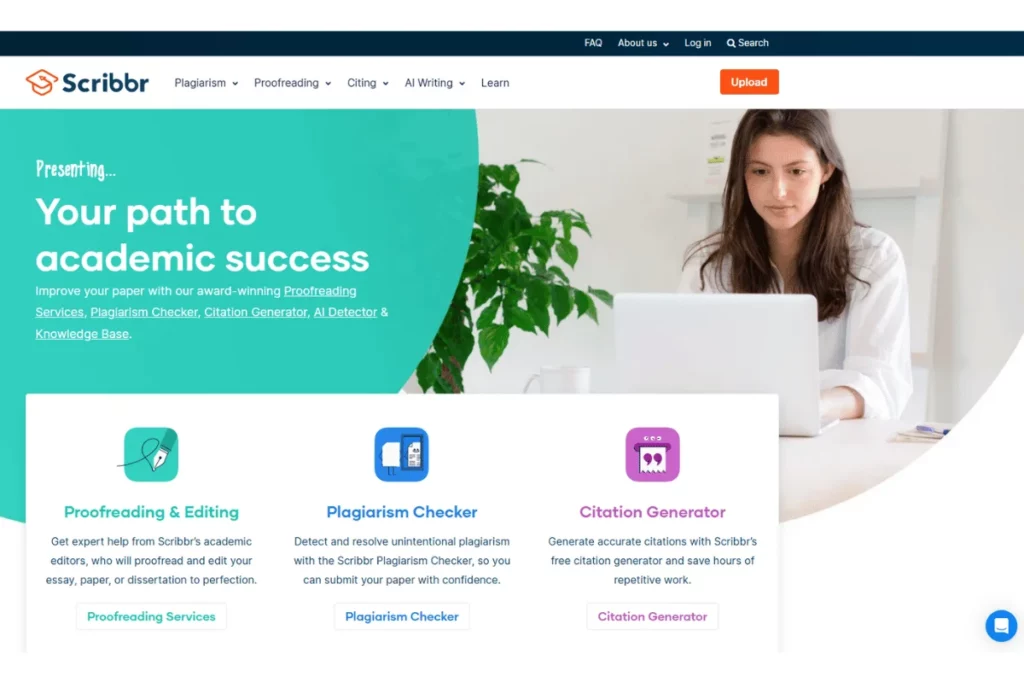
A host of tools aimed at students, including proofreading and generating citations. For plagiarism, Scribbr checks content against a vast database of billions of web pages. Add to this library by uploading past work to see if you’ve committed self-plagiarism.
Keep your data safe — go in and delete documents yourself or fall back on Scribbr’s 30-day data deletion policy. Download results in a user-friendly, color-coded report. Effective at detecting copied content, the paid version is prohibitively expensive.
Grammarly
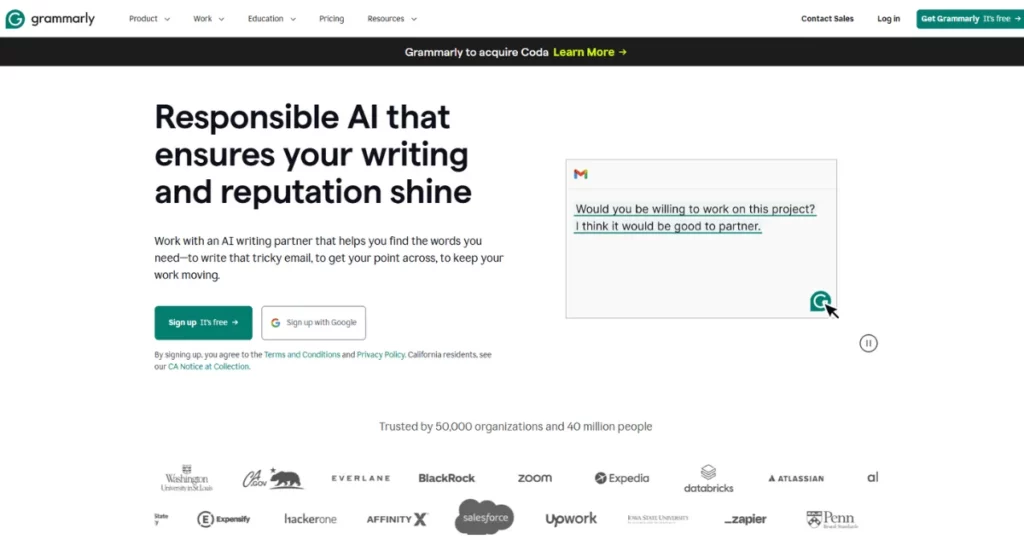
Grammarly is a writing assistant application that uses a plagiarism-checking tool. Evaluate English (only!) for clarity, spelling, tone, and engagement. Their free tier only tells you whether the content is plagiarized, not where.
Paid subscriptions offer detailed plagiarism stats. The tool cross-references an extensive database of scholarly articles and web pages. Track plagiarism as a percentage of your total document. Pinpoint copied content areas and eliminate them.
Data Analysis Tools
Get into the weeds with data analysis tools. Uncover market trends from raw data. Gather user sentiment from social listening. Collect survey data to chart demographic preferences. Use historical data to predict future user behavior. Give these a spin:
Google Analytics
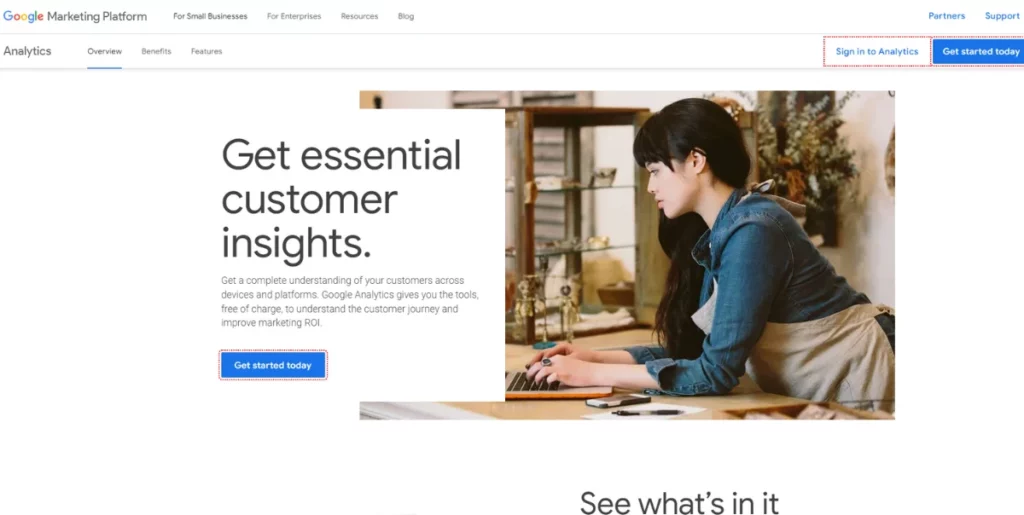
Another free tool from Google. Track a user’s every click, scroll, and hover on your website with Google Analytics. Identify user behavior across devices and platforms to see what channels perform best.
Investigate why users leave a webpage. Analytics reveal the areas that need improvement. Fix any errors or inconsistencies to optimize your webpage for user traffic.
GA helps you visualize user data, but not for long-term storage. You’ll need to download data and store it elsewhere (Marvin, perhaps?).
Tableau or Power BI
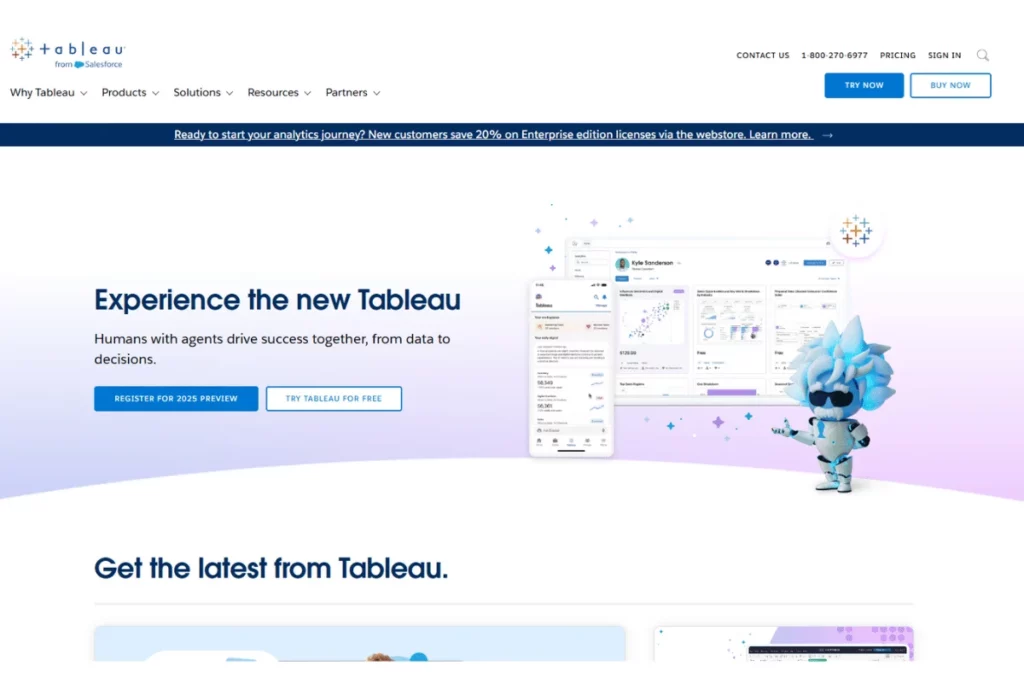
Turn boring rows and columns into interactive graphs, charts, and dashboards. Both apps help you prepare, clean, and sanitize your data in-house.
Create stunning visualizations and share them with decision-makers. Slice and dice according to what you’d like to see. Drag-and-drop gestures and easy-to-use interfaces make data exploration enjoyable. No prior coding knowledge is required.
Connect Tableau and Power BI to multiple databases for analysis in one place. Power BI works only on Windows but seamlessly integrates with MS Office apps.
Surveys and Feedback Tools
Survey tools help you gather primary data at scale and inexpensively. Use these applications to collect qualitative and quantitative feedback from a wide demographic:
SurveyMonkey
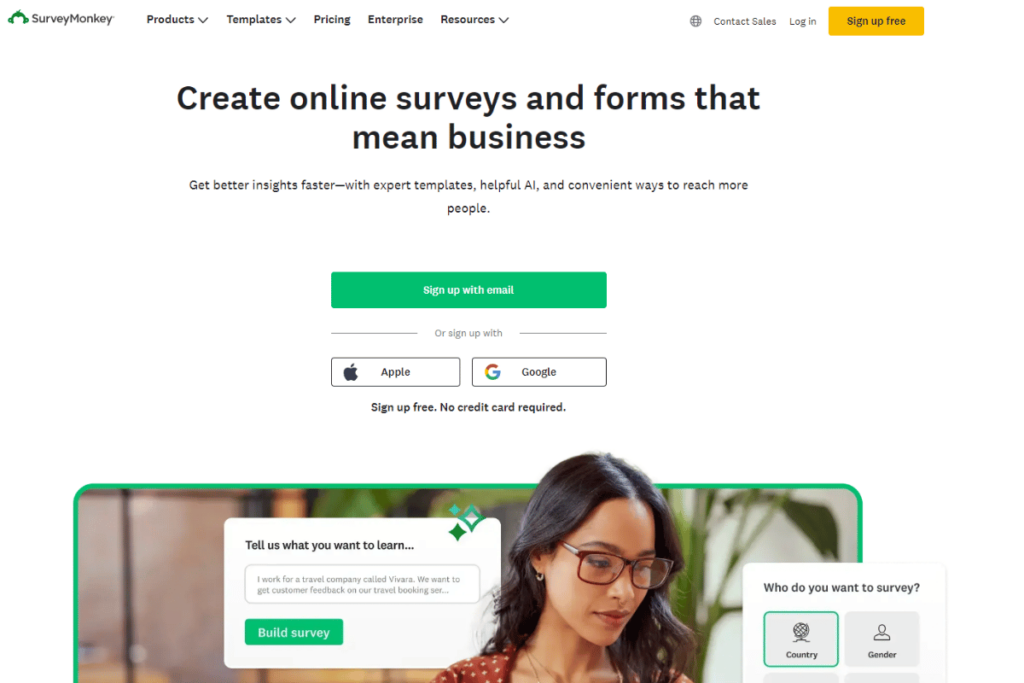
Create surveys with branching and skip logic and various question types. Word questions correctly with the help of their extensive question bank. Or generate surveys using their AI tool, powered by OpenAI. Perform sentiment analysis on open-ended responses with their NLP tech.
SurveyMonkey makes distribution and data collection a breeze. Recruit participants on the platform. Capture feedback directly from chatbots and websites. Share surveys via email, text, WhatsApp, or social media. Connect SurveyMonkey to Marvin for deeper analysis.
Typeform
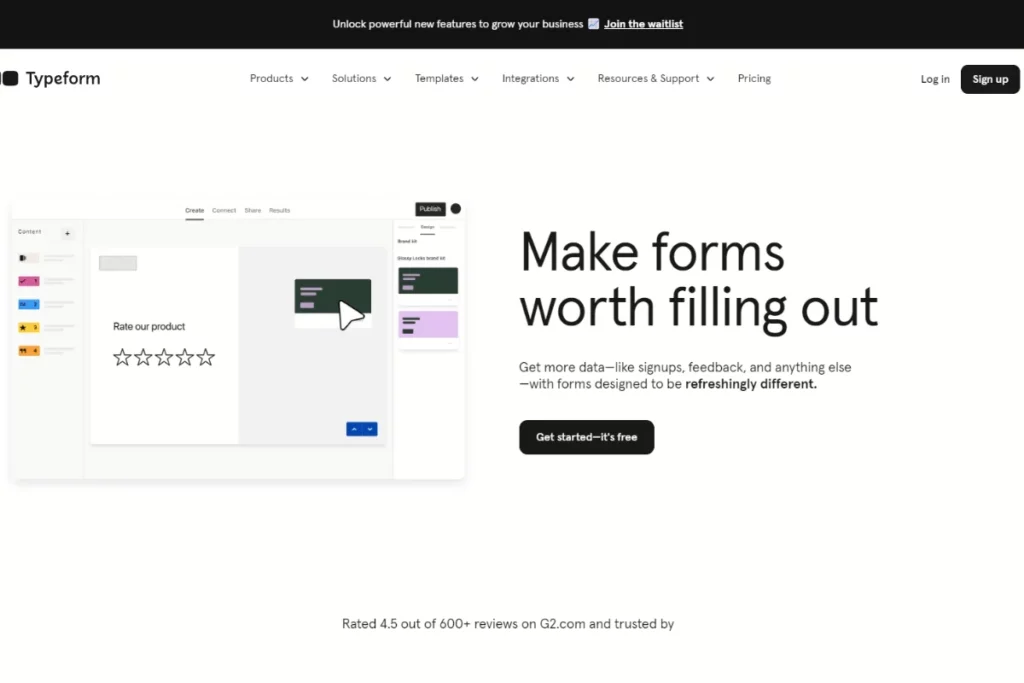
Use Typeform to create stunning and interactive surveys. Add video and other elements that engage participants. Create long-form surveys with branching logic to get deeper insights. Typeform visualizes the branches in a flow chart so you can review and edit logic.
With an intuitive user interface, Typeform simplifies the task of creating surveys. A great survey builder for beginners and experts alike. Embed surveys directly into a website — their surveys are mobile-friendly, too!
Social Media Analytics Tools
Social media has become ingrained in our lives, influencing how we think and behave. Monitor user sentiment and more with these social media analytics tools:
Sprout Social
Track key metrics and measure ROI across social media channels with Sprout Social. Their interactive analytics allows you to drill down into each channel’s performance. Choose KPIs to follow and create customizable presentation-ready reports. Easily share these with relevant stakeholders via link.
Sprout Social helps you study the business environment. Conduct competitor analysis and use social listening tools to gauge user sentiment. Stay ahead of changing market trends.
Semrush
A suite of tools for online marketing, including social media management. Plan, schedule and publish social media content using Semrush Social. Create approval processes and invite team members to manage your social accounts.
Dive into metrics with data-driven analytics to track your content’s performance. Analyze competitors’ strategies with market intelligence by tracking their content. Endlessly generate ideas and content with their AI tool. You can manage influencer campaigns, too.
Not satisfied with merely two choices in each category? Head over to our list of the top UX research tools.
How to Choose the Right Research Tools for Your Needs
Several factors determine your choice of research tool. Follow these steps for a thorough analysis of your needs before making your choice.
- Establish research goals. Identify project requirements at the outset. What does the business want to find out? What strategic business goals will the research tool support?
- Identify functionality. Assess all relevant stakeholder needs. What teams will use the platform, and how? This helps determine the type of research tool needed. Do you want to collect and analyze qualitative or quantitative data?
- Evaluate resources. What’s the resource allocation for research software? Consider the budget, time constraints, and technical expertise requirements. How much can you afford to spend on a tool?
Once established, run down the must-have features of any research tool.
Essential Research Tool Features
Although research platforms vary in function, some features are universal to all:
- Scalability. Is the tool future-proof? And flexible enough to handle growing research needs?
- User-friendliness. Is the tool easy to use? How much training effort will you need? Will everyone get up to speed quickly?
- Compatibility. Does the research tool integrate with apps from your existing workflow?
- Customer support. How helpful is customer support? Does the company provide additional resources and documentation to users?
- Shareability. Can the tool easily broadcast research findings to the rest of the organization? What communication tools does it integrate with?
- Data Security. What regional or international data compliance rules must the tool comply with?
Remember to audit several tools before making a choice. Talk to professionals who’ve used the tools you’ve shortlisted. Take advantage of free trials and freemium versions to get a sense of how the research tool works.

Best Practices for Integrating Various Tools Into Your Research Workflow
It’s not as easy as purchasing new software. Follow these steps to ensure your research tools seamlessly integrate into your workflow:
- Make a Plan. Talk with relevant stakeholders to assess existing workflows and establish requirements. Identify areas of the research process that need improvement. Set measurable and achievable goals for efficiency, resource expenditure, and business performance.
- Conduct a Trial Run. Narrow down your choice and test tools with a control group. Leverage free trials and pilot each tool with an existing project. Have team members share their thoughts on the benefits and limitations of using each. Then, choose one.
- Document Processes. Draft a master plan of how data will flow between tools. Look to automate tasks to bring efficiency to the workflow. Create comprehensive training materials & documentation to establish best practices. This ensures consistency.
- Actively Monitor. Continuous oversight helps evaluate the performance of a tool. Measure against the metrics set out above. Set up mechanisms to identify errors or delays. Constantly gather feedback from stakeholders on how to improve the workflow integration.
- Repeat. Setting up a new integration is not a one-time exercise. Chances are, you’ll make some mistakes during the first try. Learn and tweak the process as you go along. Optimizing the research workflow is a continuous craft.
Bear in mind that no integration works 100% efficiently straight off the bat. Getting it right is a function of time, thought, and effort that goes into the process.

Frequently Asked Questions (FAQs)
Still got questions? Below, we answer some of the most popular queries about research tools:
How Often Should You Conduct Market Research?
There are two types of research study, each with its own duration:
- Continuous discovery process. Firms engage in regular dialogue with customers, distributing surveys such as CSAT. Longitudinal studies evaluate metrics over time. Track user sentiment and react to behavioral changes.
- Specific projects. Explore a specific research question or test a hypothesis. From design to recruitment, through to conducting the research and analyzing results. These studies can last over 5 weeks.
Conduct project-specific studies as needed. Before or after a product launch. To investigate a change in metrics, e.g., a dropoff in conversions. Continuous dialogue keeps your finger on the user’s pulse.
What Are the Most Accurate Tools for Market Research?
Accurate market research insights can be the difference between success and failure.
Inaccurate plagiarism checks and industry statistics land you in trouble down the road. When choosing a market research tool, test its advertised accuracy. Pit automation against manual research – have them carry out the same task. Manual work will be highly accurate every time — that’s the bar.
From our list above, Google tools listed accurately reflect market trends. With all the others, it’s all about the quality of data input.
What Are the Costs Involved in Using Market Research Tools?
UX research tools pricing depends on the capabilities you’re looking for.
Our list above includes both free and paid market research tools. Monthly fees per user can go up to $200 per month. Some tools offer more functionality than others and have a higher price tag. Consider the number of licenses needed and your budget carefully.
Almost all apps have limited free versions that let you try before you buy. Leverage these plans when auditing different research tools. Have research team members and key stakeholders test it out. They’ll be interacting with it most, so their preferences matter the most.

Conclusion — Top Tools for Research
Online market research platforms help businesses understand more about their environment. They assist in data collection, analysis, visualization, and reporting.
Research tools are capable of handling vast amounts of data far beyond what humans can manage. They generate reliable and accurate findings that inform different departments at a company.
Designers delve deep into customer behavior with research tools. They establish demand levels for a product and identify factors influencing user behavior. Valuable user input helps them make improvements to the user experience.
Marketing teams stay informed of current trends. They spot opportunities or threats in external market forces, acting on them instantly. Sales might incorporate changes into their approach to get more conversions.
Research tools promote evidence-based decision-making. No more relying on gut feelings and hunches.
Marvin is the ultimate market research assistant. Want to learn more? Book a demo with our experts today.

