
Research can feel both exhilarating and exhausting.
You collect endless notes, quotes, and user insights to gain clarity. But when it comes to making sense of it all? You’re left with heaps of data, a hundred sticky notes, and no idea where to start.
You need a way to cut through the clutter, spot the patterns, and confidently guide your next steps. That way is affinity mapping UX.
Let’s show you how affinity maps work and why they’re a must-have for every UX professional.
What Is Affinity Mapping?
Affinity mapping is a process for organizing and analyzing user data or research insights. This method is particularly useful in UX, where it:
- Pulls out key quotes or observations from user interviews or other types of research;
- Clusters them into groups such as pain points, feature requests, or behaviors;
- Reflects patterns in what users need or want.
This simple but powerful method turns messy piles of information into something clear and actionable.
For years, affinity mapping involved filling an entire wall or whiteboard with sticky notes. Each note would contain relevant information to be grouped by common, specific criteria.
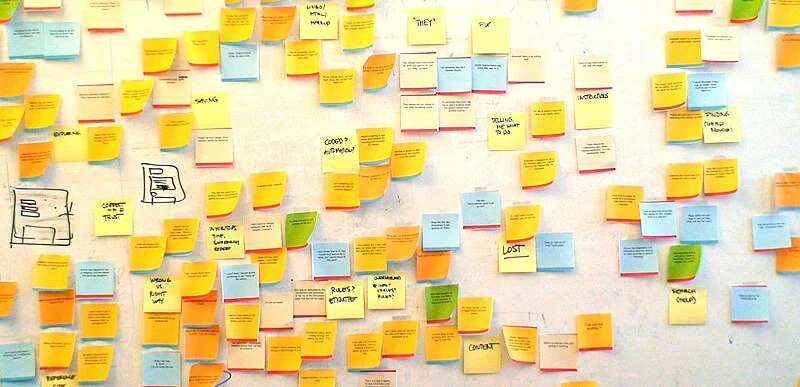
Example of affinity mapping exercise (Source)
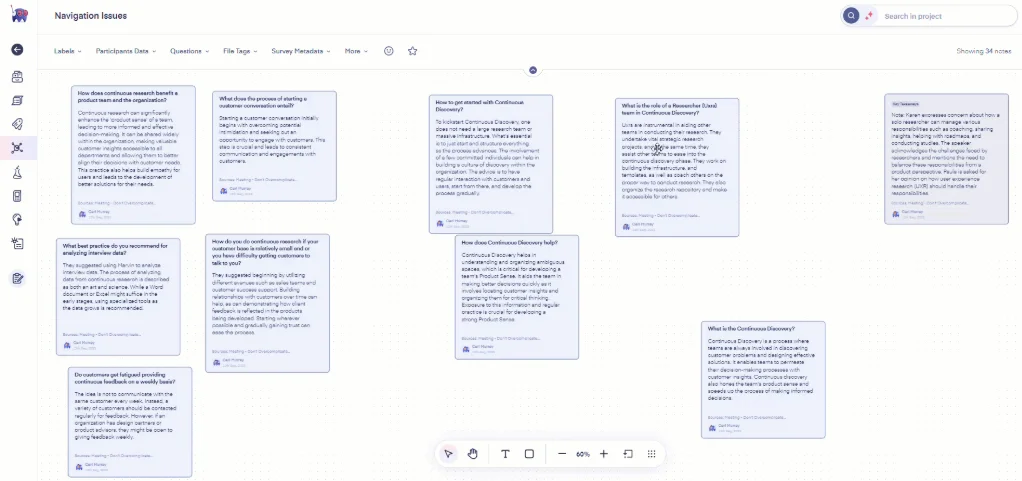
However, with the advances in AI technology, tools are now speeding up this process. Our AI-powered UX research platform will:
- Centralize all your user data
- Let you do the affinity mapping using canvas boards
- Automate the thematic analysis for you
- Integrate with other affinity mapping tools like Miro and FigJam
Create a free account with Marvin today to reduce the time you spend on insights and affinity mapping by days.
Difference Between Affinity Mapping and Affinity Diagramming
Often used together, affinity mapping and affinity diagramming are different things.
One is the process, and the other is the output, as you can see in this side-by-side breakdown:
| Affinity Mapping | Affinity Diagramming |
| Flexible and informal process | Structured and formalized output |
| Used to organize and group raw data | Used to present finalized insights |
| Helps you find patterns and relationships | Helps others understand the findings |
For example, you have just completed a round of user interviews.
You extract the main findings and group similar ideas together, which is affinity mapping.
Later, you clean up the groups, label them, and create a digital diagram of your most significant finding. That’s affinity diagramming, ready to be shared with your team.
Why Affinity Mapping Is Essential in UX
Affinity mapping filters your research. It takes raw user data and turns it into clear, actionable insights to guide your designs.
With affinity mapping in your UX toolbox, you can:
- Uncover hidden patterns: Mapping connects the dots in user feedback and pulls out insights you might otherwise miss. For example, grouping complaints about “slow load times” and “laggy animations” could reveal performance as a key issue to tackle.
- Collaborate easier: Sorting ideas into visual groups creates a shared understanding among your team. Everyone sees the same patterns, which results in fewer debates and smoother decision-making.
- Simplify complex data: Research can feel overwhelming, but affinity mapping breaks it down into bite-sized pieces. Instead of a mountain of sticky notes, you’ll see clear categories such as “pain points” or “feature requests.”
- Sharpen your focus: Its clarity will keep your team aligned on what matters. It will also save you time and energy when moving into design phases like wireframing or prototyping.
- Work faster: Whether using interviews, surveys, or usability tests, affinity mapping adapts to any research format. You can use it in workshops or individually to get results quickly.

How to Create an Effective Affinity Diagram
We’ve seen that the diagram is the result of the mapping process. Therefore, creating an affinity diagram starts with organizing data and ends with a clear, actionable visual.
Here’s the entire process, including how to refine your work into a polished diagram:
1. Start with Clear Data
First, gather your research findings — user testing quotes, survey results, or qualitative interviews. If you’re going to do this manually, arm yourself with lots of sticky notes. If you have a digital tool up your sleeve, tag your most relevant user data.
Whatever method you choose, you want to break the research down into short, specific phrases, such as:
“Struggles to find the account deletion option”
“Confusion from inconsistent labeling across pages”
2. Group Related Data
This step is about exploring, so don’t obsess about perfection. Just trust your instincts and look for natural connections. Group the common phrases into clusters.
Earlier, you identified “Struggles to find the account deletion option” and “Confusion from inconsistent labeling across pages.” Now, you can group both into a cluster labeled “Navigation and Labeling Issues.”
Feel free to refine the cluster further as patterns emerge.
3. Label Your Clusters
Once groups form, create concise labels that reflect their themes.
Use action-focused or problem-specific terms, such as “Navigation Frustrations” or “Saving Issues,” to keep categories relevant and clear.
4. Review and Refine
Step back and check for gaps or inconsistencies. Are any clusters too broad? Could you combine or split some of them for more clarity?
This review ensures your work is meaningful and easy to understand later.
5. Visualize the Affinity Diagram
Create the final diagram using your refined clusters. Arrange the groups in a way that is easy to read and visually logical.
For internal teams, a simple grid or board view might work. For stakeholders, try a more polished flowchart or presentation-style layout.
6. Add Supporting Details
Enhance the diagram with key details. If needed, include subcategories or highlight relationships between groups. For example, draw arrows between “Navigation Frustrations” and “Onboarding Pain Points” to show overlap.
Additionally, you can use colors to highlight categories, priorities, or relationships. Red is great for urgent issues, while green can highlight opportunities.
7. Share and Use the Diagram
Make the diagram accessible to your team or stakeholders. Because it’s a collaboration tool, it must be clear and actionable.
Use your affinity diagram to guide design decisions and prioritize fixes for top user pain points.

Top 3 Affinity Mapping Tools
The right tool can make affinity mapping faster, clearer, and even a little fun.
Whether brainstorming with a team or organizing research yourself, the following tools will keep your process smooth and your insights actionable:
1. Marvin
Our UX platform is a research-first affinity mapping tool combining AI automation and manual refinement.
Marvin’s unique strength is its ability to simplify the research-to-insight journey. Although a research tool at its core, it integrates affinity mapping into the entire research workflow.
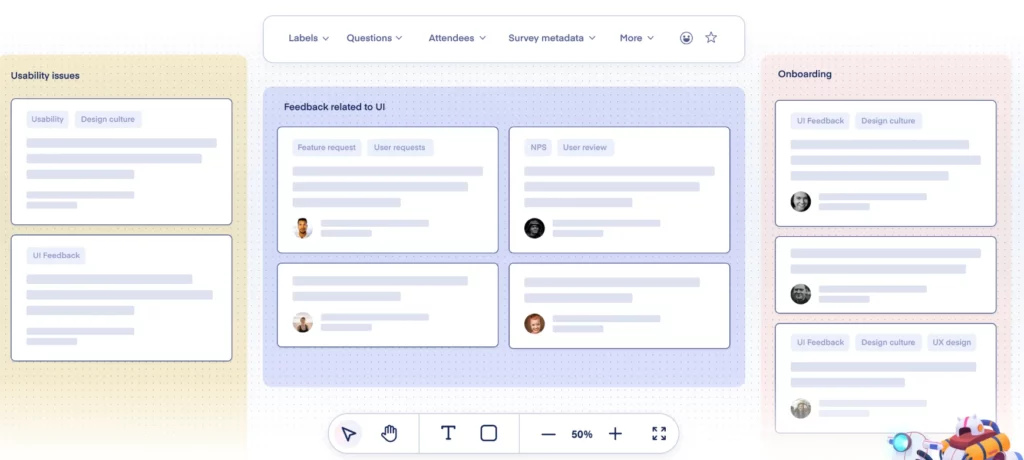
Marvin features Canvas Boards, allowing you to visualize and cluster data while leveraging AI to pre-analyze insights. This feature simplifies mapping by identifying themes, sentiments, and trends upfront.
When doing affinity mapping with Marvin, you can add up to 500 notes per canvas, making it perfect for large datasets. You can also filter and organize notes directly within the platform or export them to tools like Miro for further customization.
Book a demo today to discover how Marvin transforms research into actionable insights in hours (instead of days), making affinity mapping a breeze.
2. Miro
With an intuitive interface and flexible canvases, Miro is another tool for visual affinity mapping. Its digital sticky notes and color-coding options allow you to organize ideas into clear clusters.
It offers pre-built templates designed explicitly for affinity diagrams. These templates save time and provide a structured framework for organizing data.
Accessible across desktop and mobile platforms, Miro is convenient when you want to refine or review diagrams on the go.
3. Lucidchart
Lucidchart offers a user-friendly drag-and-drop interface for creating professional-grade affinity diagrams.
It features pre-built templates tailored for clustering and brainstorming, saving time while maintaining a polished, consistent framework.
This tool supports real-time collaboration, allowing team members to work together from anywhere, whether synchronously or asynchronously.
In addition to affinity mapping, Lucidchart also has flowcharts, wireframes, and other diagrams. It’s a versatile choice for multi-purpose visual projects.

Tips for Effective Affinity Mapping in UX Workflows
As a cornerstone of UX research, affinity mapping is more complex than sticking notes on a board.
The goal is to make this process work for you and your team, so here are some tips to help you get the most out of affinity mapping:
- Start with a clear question or goal: Define what you’re trying to uncover before mapping. A clear goal keeps the process grounded and avoids unnecessary clusters.
- If you’re analyzing usability test results, focus on identifying pain points or areas for improvement.
- Limit your data to what matters: Don’t overwhelm your board with every single insight. Choose data that aligns with your goal.
- If you’re refining a checkout flow, stick to feedback about that experience rather than general app comments.
- Involve the right people: Invite team members who bring fresh perspectives. Diverse input helps you create more balanced clusters.
- Developers might spot technical challenges, while customer support can highlight recurring issues.
- Test your groupings with “why” questions: Double-check that your categories are logical and useful. If there’s no clear correlation, you might need to split or rethink the group.
- After forming clusters, ask, “Why does this data belong together?”
- Use visuals to highlight relationships: When your clusters are done, draw lines or add notes to show overlaps.
- You might link “Search Bar Issues” and “Content Accessibility Problems” to emphasize how users struggle to locate and access relevant information.
Frequently Asked Questions (FAQs)
Here are a couple more things you need to know about affinity mapping before you get to work:
How Does Affinity Diagram UX Help Design Teams?
Affinity diagrams distill the research and paint a clear picture. This method encourages collaboration, ensures everyone’s on the same page, and keeps the focus on user needs.
By organizing insights into themes, design teams can quickly spot patterns and make informed decisions.
What Are the Best Tools for Affinity Mapping?
The best tools depend on your workflow. Physical sticky notes and a whiteboard work well if you prefer hands-on sessions (and have a reasonable amount of data to review).
For digital setups and advanced analysis, Marvin is the best tool for visualizing clusters.
How Is Affinity Mapping Different from Affinity Research?
Affinity mapping is a method for organizing ideas into clusters to find patterns. Affinity research, on the other hand, is a broader process of exploring relationships or themes across data.
Mapping is a specific step in research that organizes findings. Affinity research often includes other steps, such as data collection and analysis.
How Do You Simplify the Affinity Diagram Process?
You can simplify the process by keeping it focused and streamlined:
- Know what you’re looking to achieve and what your goal is.
- Use brief phrases or keywords for each data point to avoid clutter.
- Focus only on the insights that align with your goal.
- Don’t overthink your initial clusters; you can always refine them later.
- Use digital tools like Marvin to analyze and organize data easily.
Conclusion
Gathering user data is easy. The real challenge is turning all that feedback into clear insights that show you where to go next.
That’s why affinity mapping is key to designing solutions that truly meet user needs. Now that you know how to use and streamline it, you can unlock patterns faster than ever.
Sign up for Marvin today to automate your research collection and analysis. Our AI-powered research assistant does all the tedious work required before affinity mapping. Use it to speed up the process by days!